
What is a Fluorophore?
A fluorophore is a molecule whose structure allows it to absorb a photon of light and then emit a photon of light at a lower energy (longer wavelength).
Practically speaking, all normal matter absorbs electromagnetic (EM) radiation to some degree. Most often this will cause objects to heat, and then they will release heat as infrared (blackbody) radiation. However, fluorophores are special in that they will not only absorb EM radiation in the UV and visible spectrum, but will also then emit light back out in the visible spectrum, in a process known as luminescence. The light emitted by a fluorophore is always of lower energy than the original light it absorbed. This difference in energy (wavelength) is known as a stokes shift, and is one of the reasons why fluorophores are so useful.
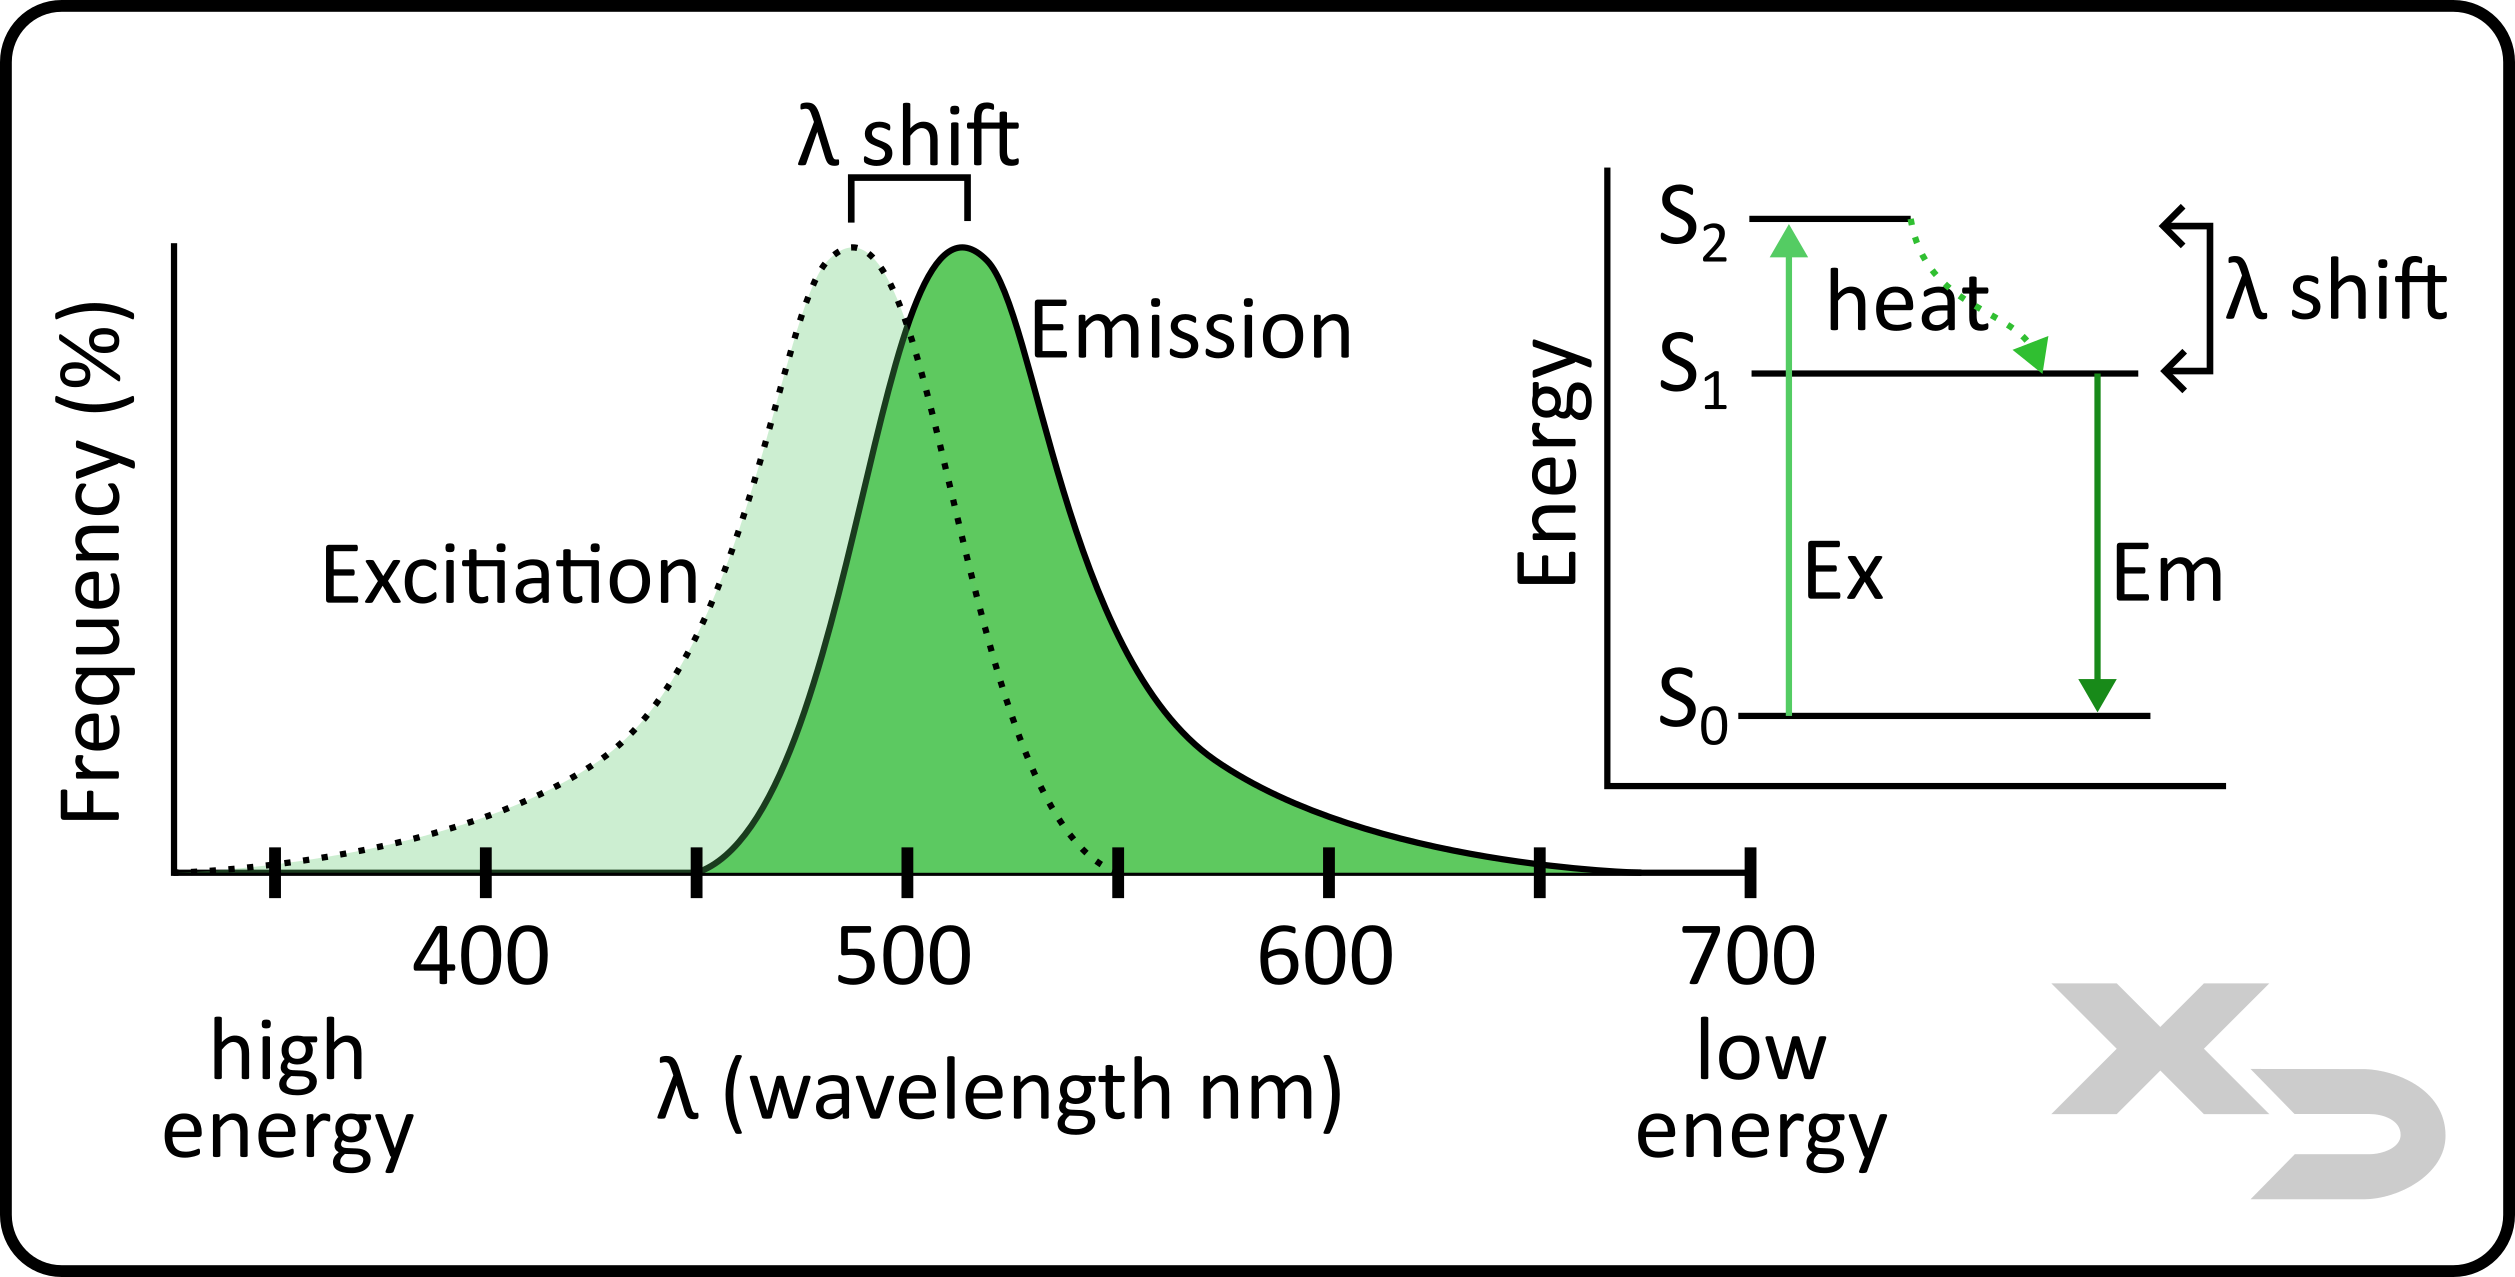
Figure: Depiction of fluorescence excitation (dashed line) and emission (solid line). Fluorophores can both absorb and emit a wide range of wavelengths; however, the emitted photon will always be lower energy. The Jablonski diagram in the figure illustrates this, as the fluorophore is excited by a large amount of energy, before the fluorophore can emit the energy back out, a small amount of energy is converted to vibrational motion (heat) of the atoms.
Why are fluorophores useful
The ability to excite a fluorophore and have it respond by emitting visible light makes it incredibly useful as a visual reporter for biological experiments. By fluorescently tagging specific components in cells or tissue it allows us to detect those components that we normally would not be able to observe by light microscopy alone.
Every fluorophore has a different stokes shift, the difference in wavelength between excitation (the absorbed light) and emission (the released light). This means that multiple fluorophores can be excited by the same wavelength of light (e.g. laser excitation), but emit different wavelengths, allowing them to be distinguished. This is the basis for fluorescence panels: groups of fluorophores that can be excited by the instruments laser(s), but have distinctive emissions.
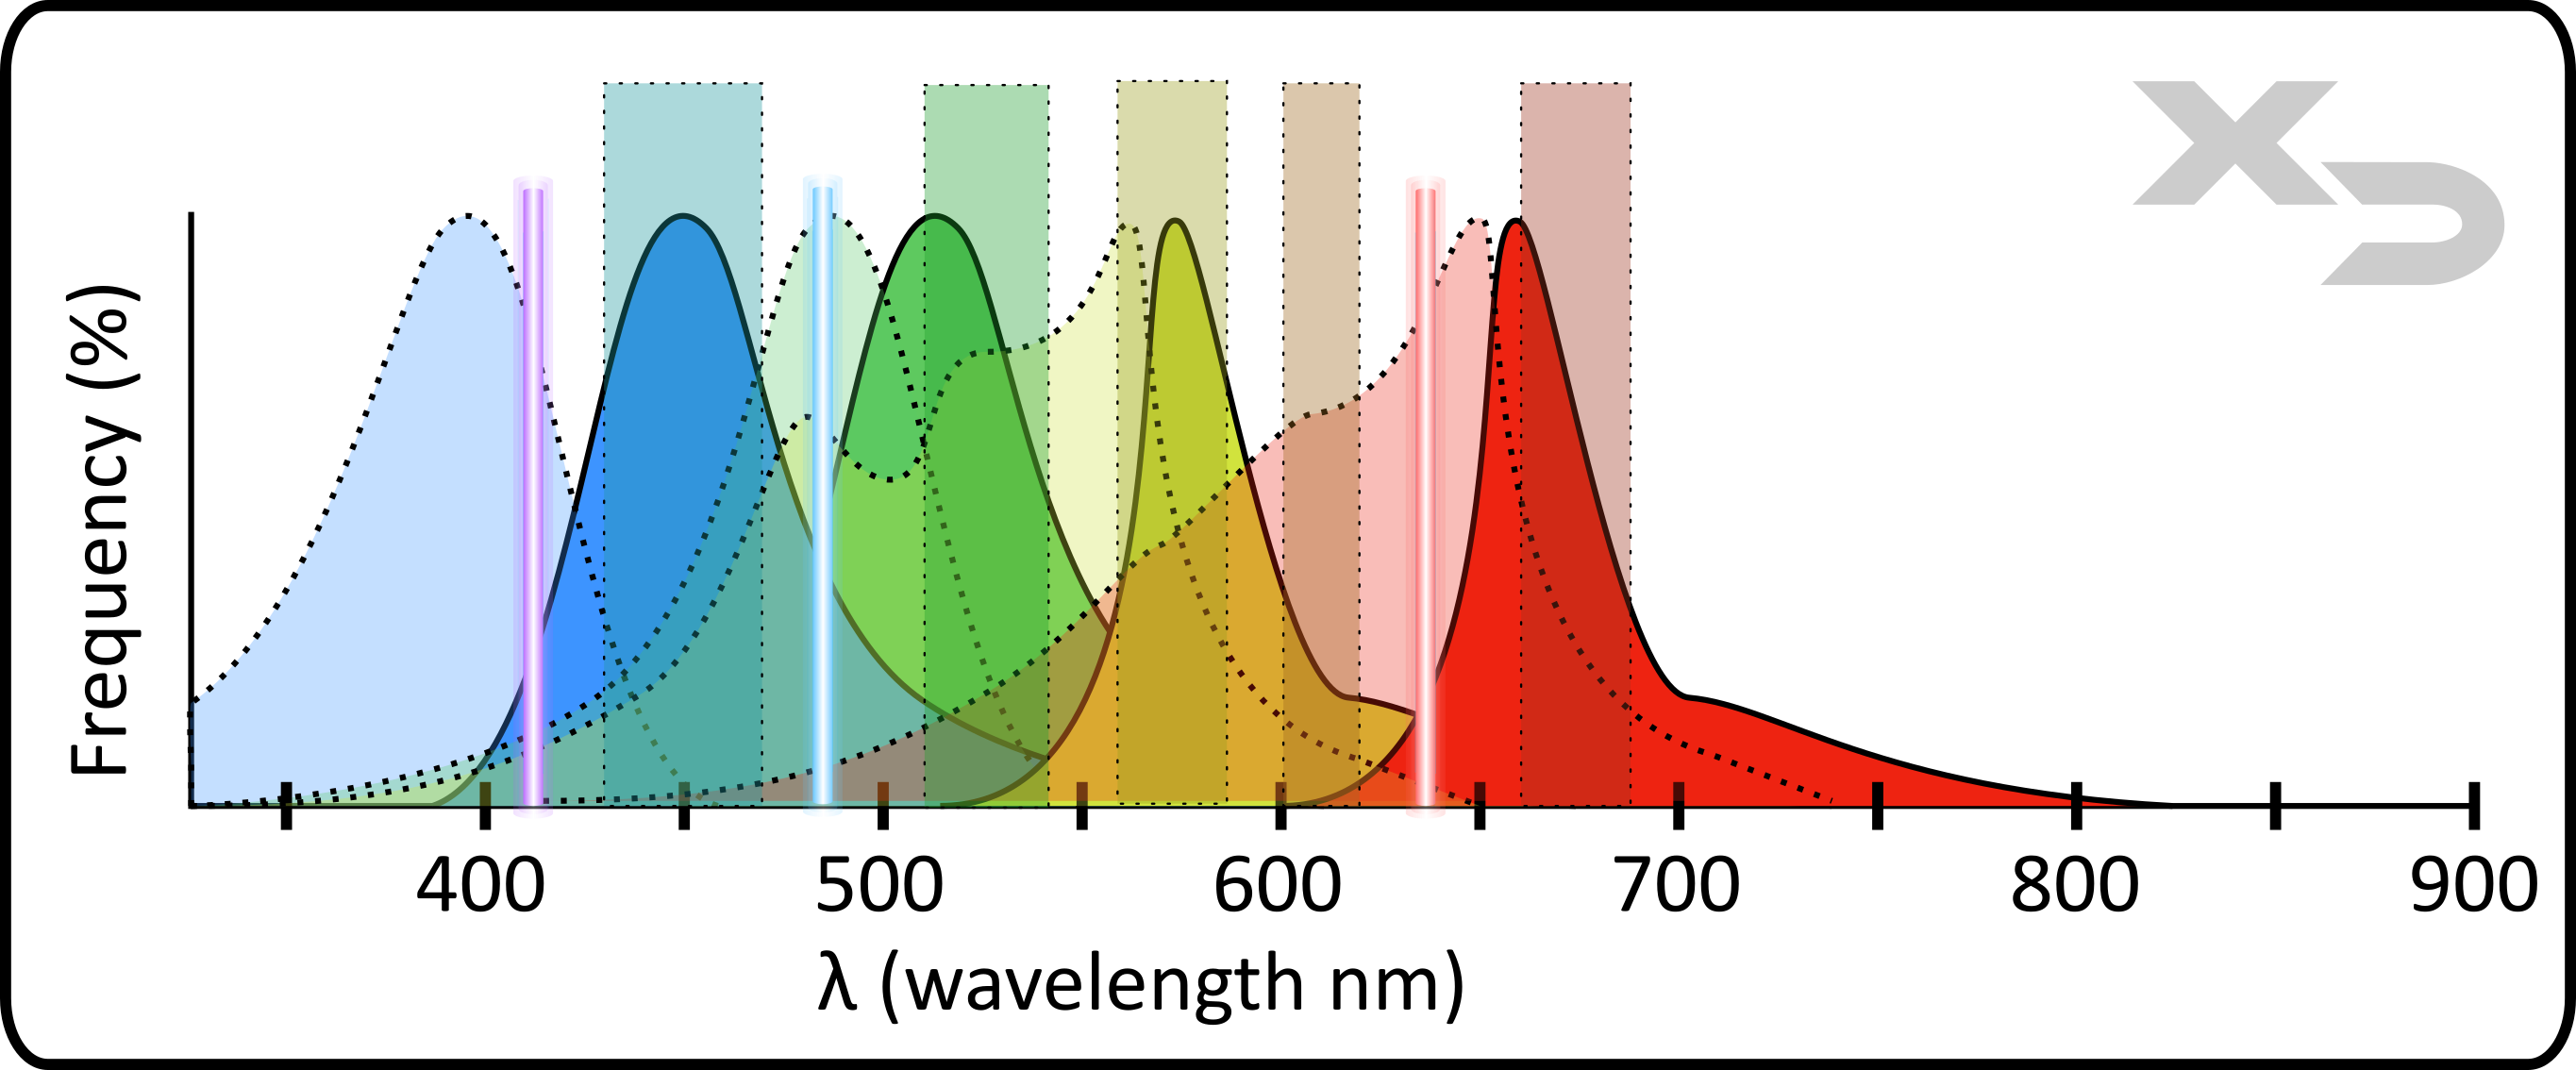
Figure: Example of a fluorescence panel (4-colors). Instrument components are: laser (colored vertical lines) and filters (colored vertical bars). Fluorophore components are: excitation (dashed lines) and emission (solid lines).
How to design a flow panel
There are three main factors to consider when designing a flow cytometry panel of fluorophores: excitation, emission, and spillover. Each factor is discussed in more detail below, but briefly, the fluorophore chosen needs to be able to be excited by the instruments laser and its emission needs to fall within the range of one of the instruments filters/detectors. Both excitation and emission wavelengths for fluorophores are often very broad, as such the λmax (maximum/peak wavelength) does not need to exactly match with laser excitation and filter wavelengths, but it should be close. Lastly, because fluorophore emission wavelengths are so wide, there will almost always be a small amount of emission that is detected by one or more filters/detectors other than the intended filter/detector; this is known as spillover. Spillover can be adjusted for mathematically after the fact (e.g. compensation of the data); however, it is best to minimize it as much as possible during assay design.
Excitation
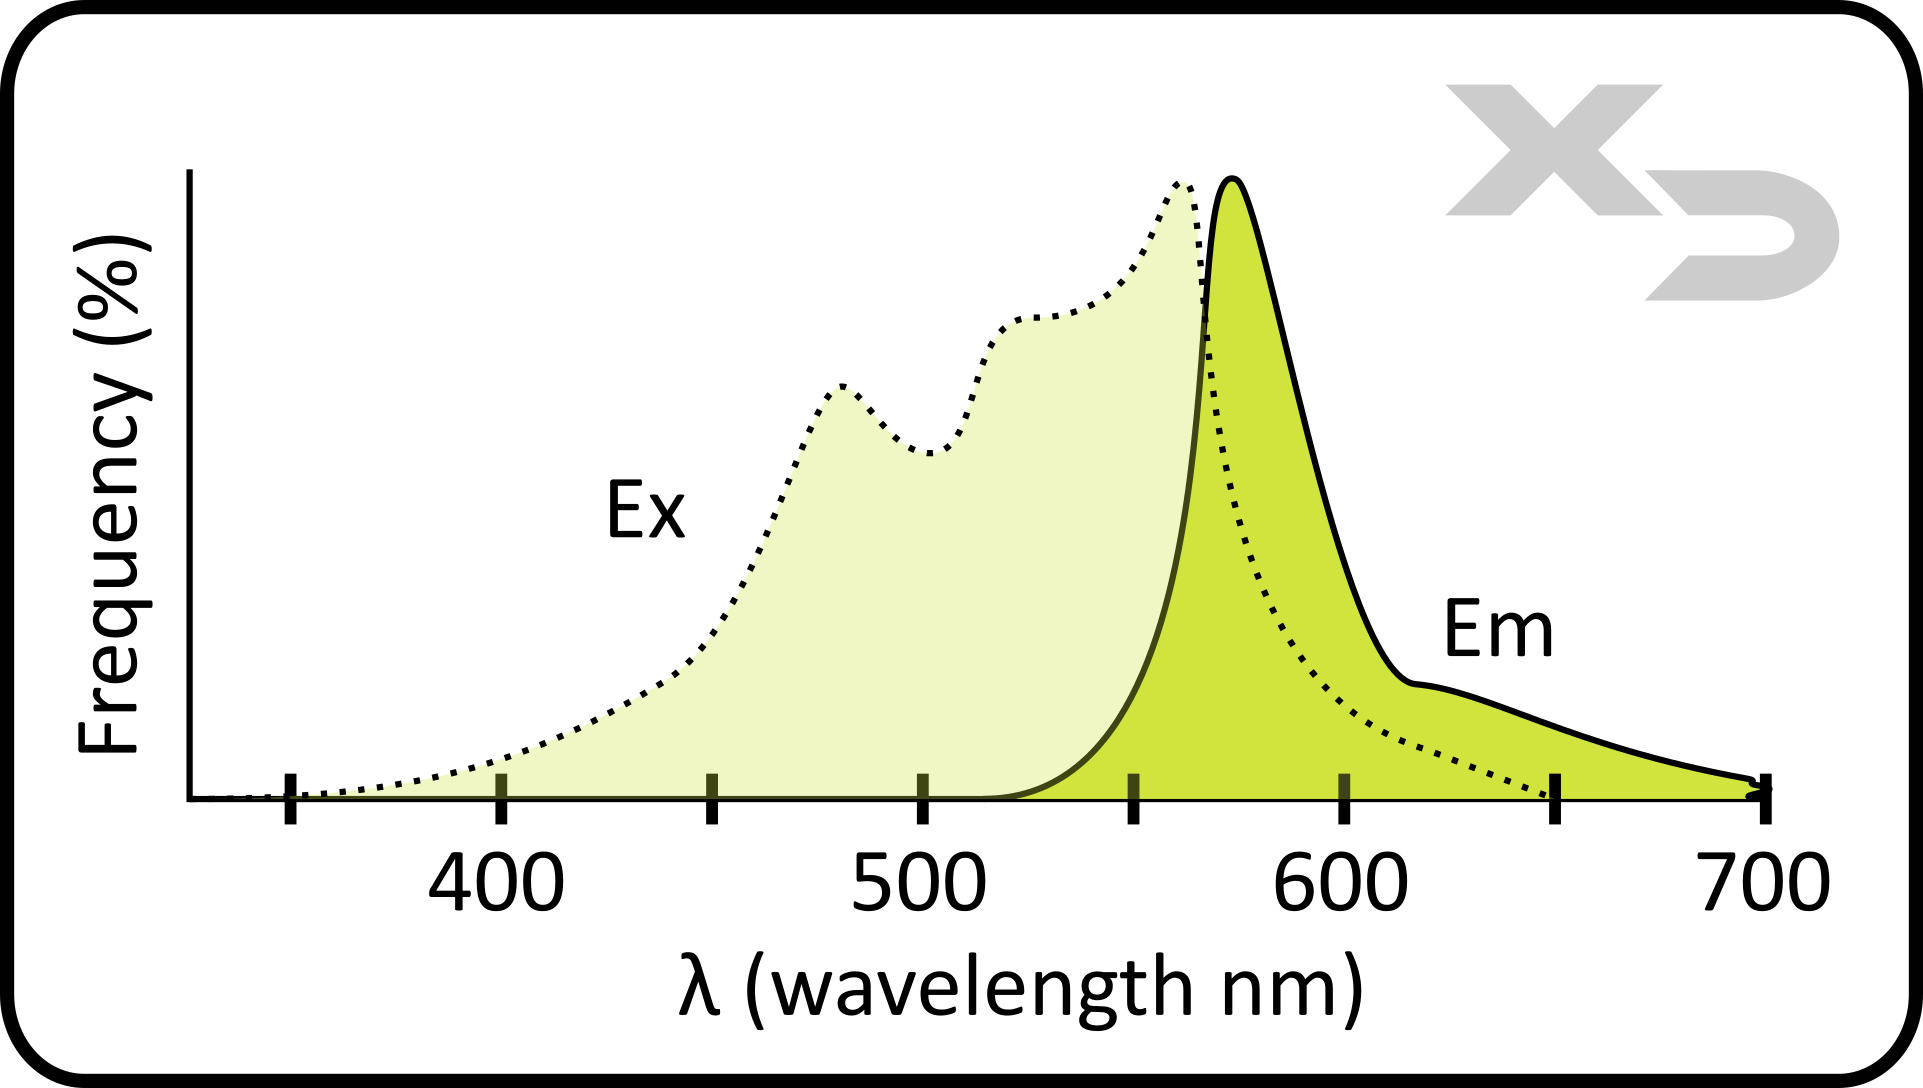
The fluorophore chosen needs to have an excitation spectrum that matches with the instrument’s laser(s). Often times when using a new fluorophore, it is very helpful to look up its spectral characteristics. Normally product packaging for fluorophores will only report the maximum/peak wavelength (λmax) for excitation and emission; but it gives no indication on how broad those absorbance and emission peaks are. For example, the figure below shows the fluorescent spectra of the fluorophore phycoerythrin (PE). The absorbance (excitation) spectra of PE has a λmax around 565nm, however the profile is quite wide with a significant secondary peak around 475nm. This means that, depending on the specific instrument lasers, PE could be excited by more than one laser. For example, some common lasers (which PE would interact with) are: blue laser at 488nm, green laser at 532nm, and yellow laser at 561nm.
Fluorescent spectra for the majority of commercial fluorophores can be found on a number of websites; however, it is often useful to use panel design software where users can input their instrument configuration and check for fluorophore compatibility. There are several free online panel design tools including from BD Biosciences and Thermo-Fisher among others.
The amount of emission will depend on exactly where in the spectra the fluorophore is exited. For example, while a violet laser (405nm) may technically fall within the absorbance spectra of PE, the frequency at which PE will absorb violet light is so minimal, that the emitted light will also be minimal. As such, it is okay if the fluorophore can be excited by other lasers, as long as the unwanted emission is minimal and doesn’t interfere with filter/detection of other fluorophores in the chosen panel (see spillover for more info).
Emission
The emission of a fluorophore is what will be physically measured by the instrument, therefore it is important to verify that the fluorophores emission matches well with the filter/detector. The spectral range of a fluorophore’s emission is often quite wide, much wider than the wavelength range of the filter/detector. While the maximum/peak wavelength (λmax) for emission doesn’t need to fall within the filters range, it should be close in order to maximize the amount of fluorescence detected.
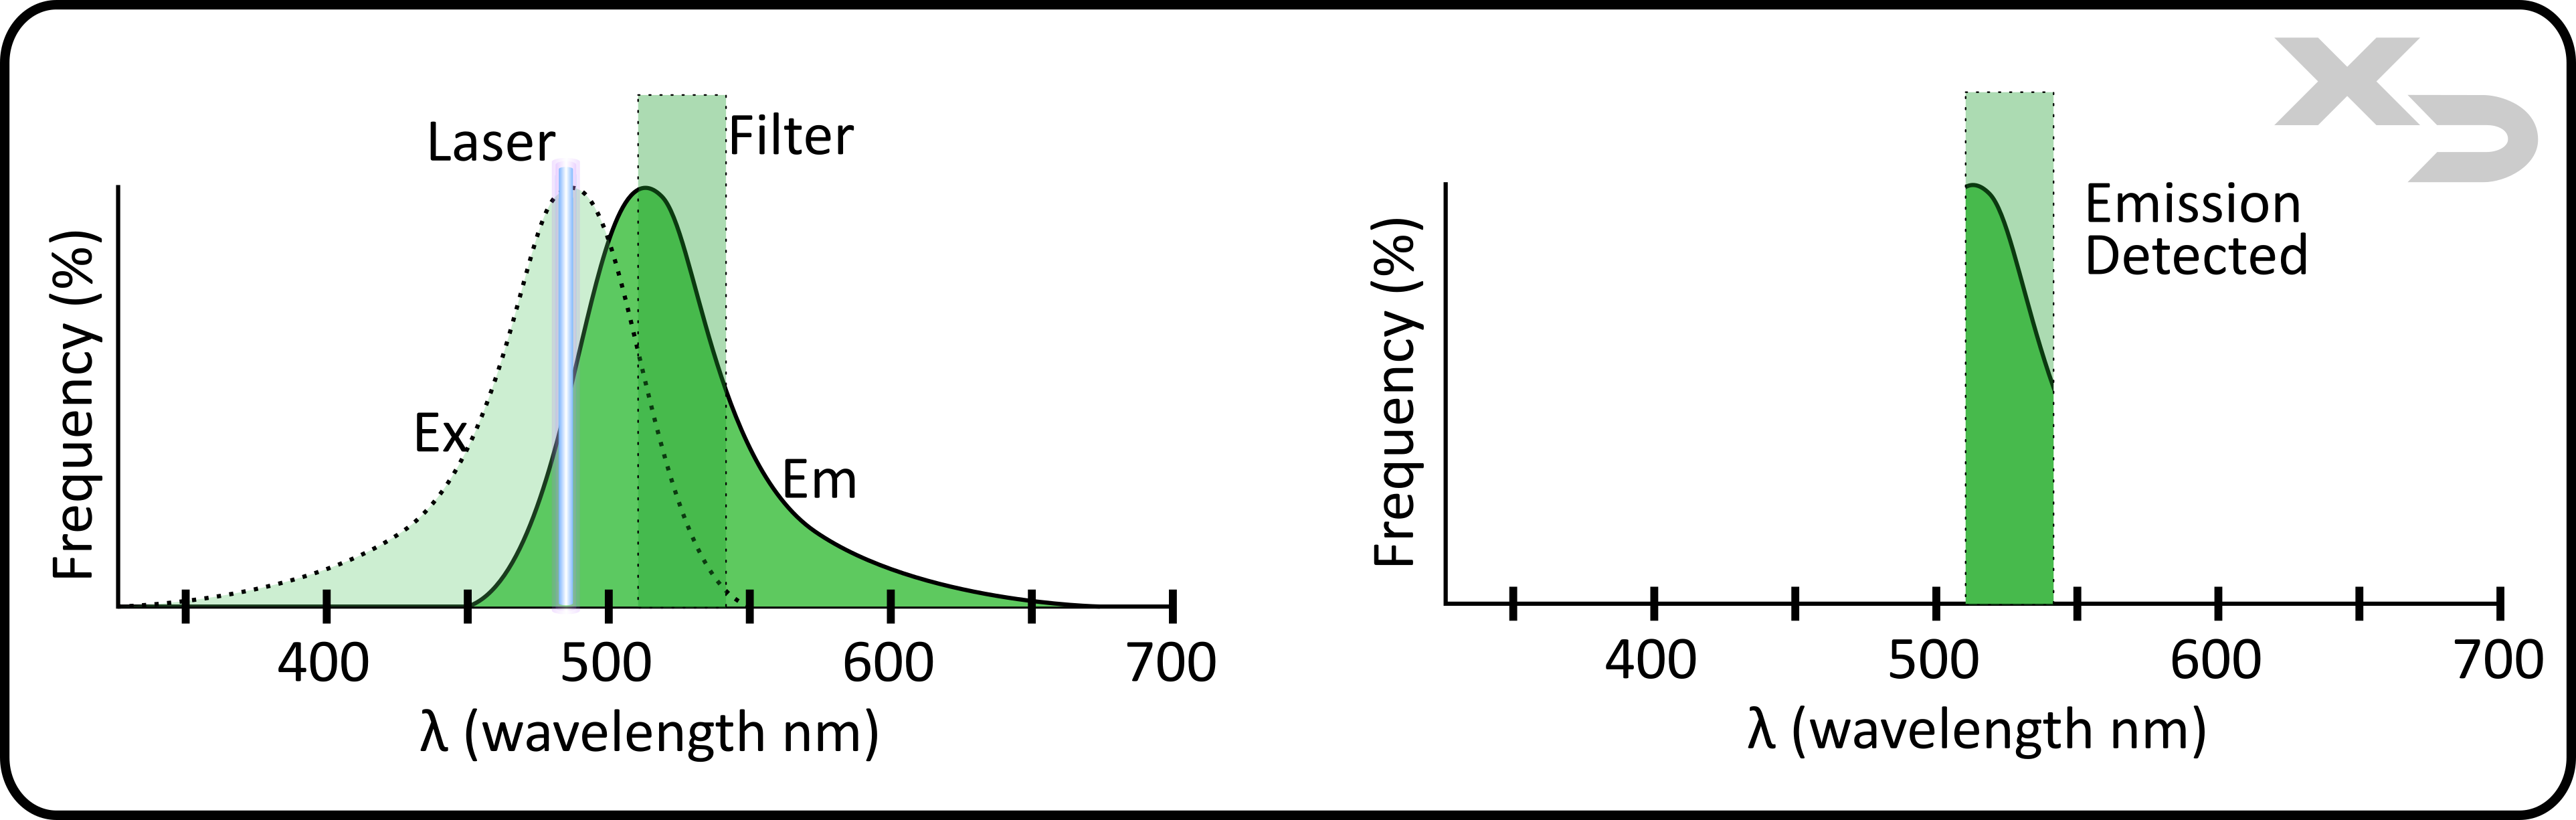
Figure: Excitation and emission spectra of FITC overlayed with instrument laser (blue 488nm) and filter (B530). Graph (right) indicates the emission spectra that is detected in fluorescent channel after passing through filter.
Spillover
Spillover refers to the concept that fluorescence emission from a single fluorophore is observed in multiple filter/detector channels. This is not an issue if there are no other fluorophore markers being used; however, if the spillover occurs in a filter channel that is being used for a different fluorophore, then the results will be skewed to appear stronger (more fluorescent) than they actually are (e.g. false-positive signal).
This occurs because the emission spectra is always much wider than the wavelength range of a filter (typically 25-40nm). Instrument manufactures can prevent this by spacing filters further apart, but the detection range (visible spectrum) is only so wide. Increasing the spacing between filters reduces the number of filters and the number of “colors” an instrument can detect. Rather than having fewer filters with greater spacing between them, spillover can instead be mathematically corrected
Compensation
The process of adjusting for spillover is called Compensation, and is calculated by determining the individual contribution of a fluorophore into every filter channel. For example, in the figure below, FITC (green) and PE (yellow) are both excited by the same laser, but FITC’s emission aligns better with filter channel #1, whereas PE’s aligns better with filter channel #2. When both fluorophores are used at the same time spillover occurs, confounding the results. In order to correct for this, both FITC and PE have to be analyzed first individually, to see what fraction of spillover occurs.
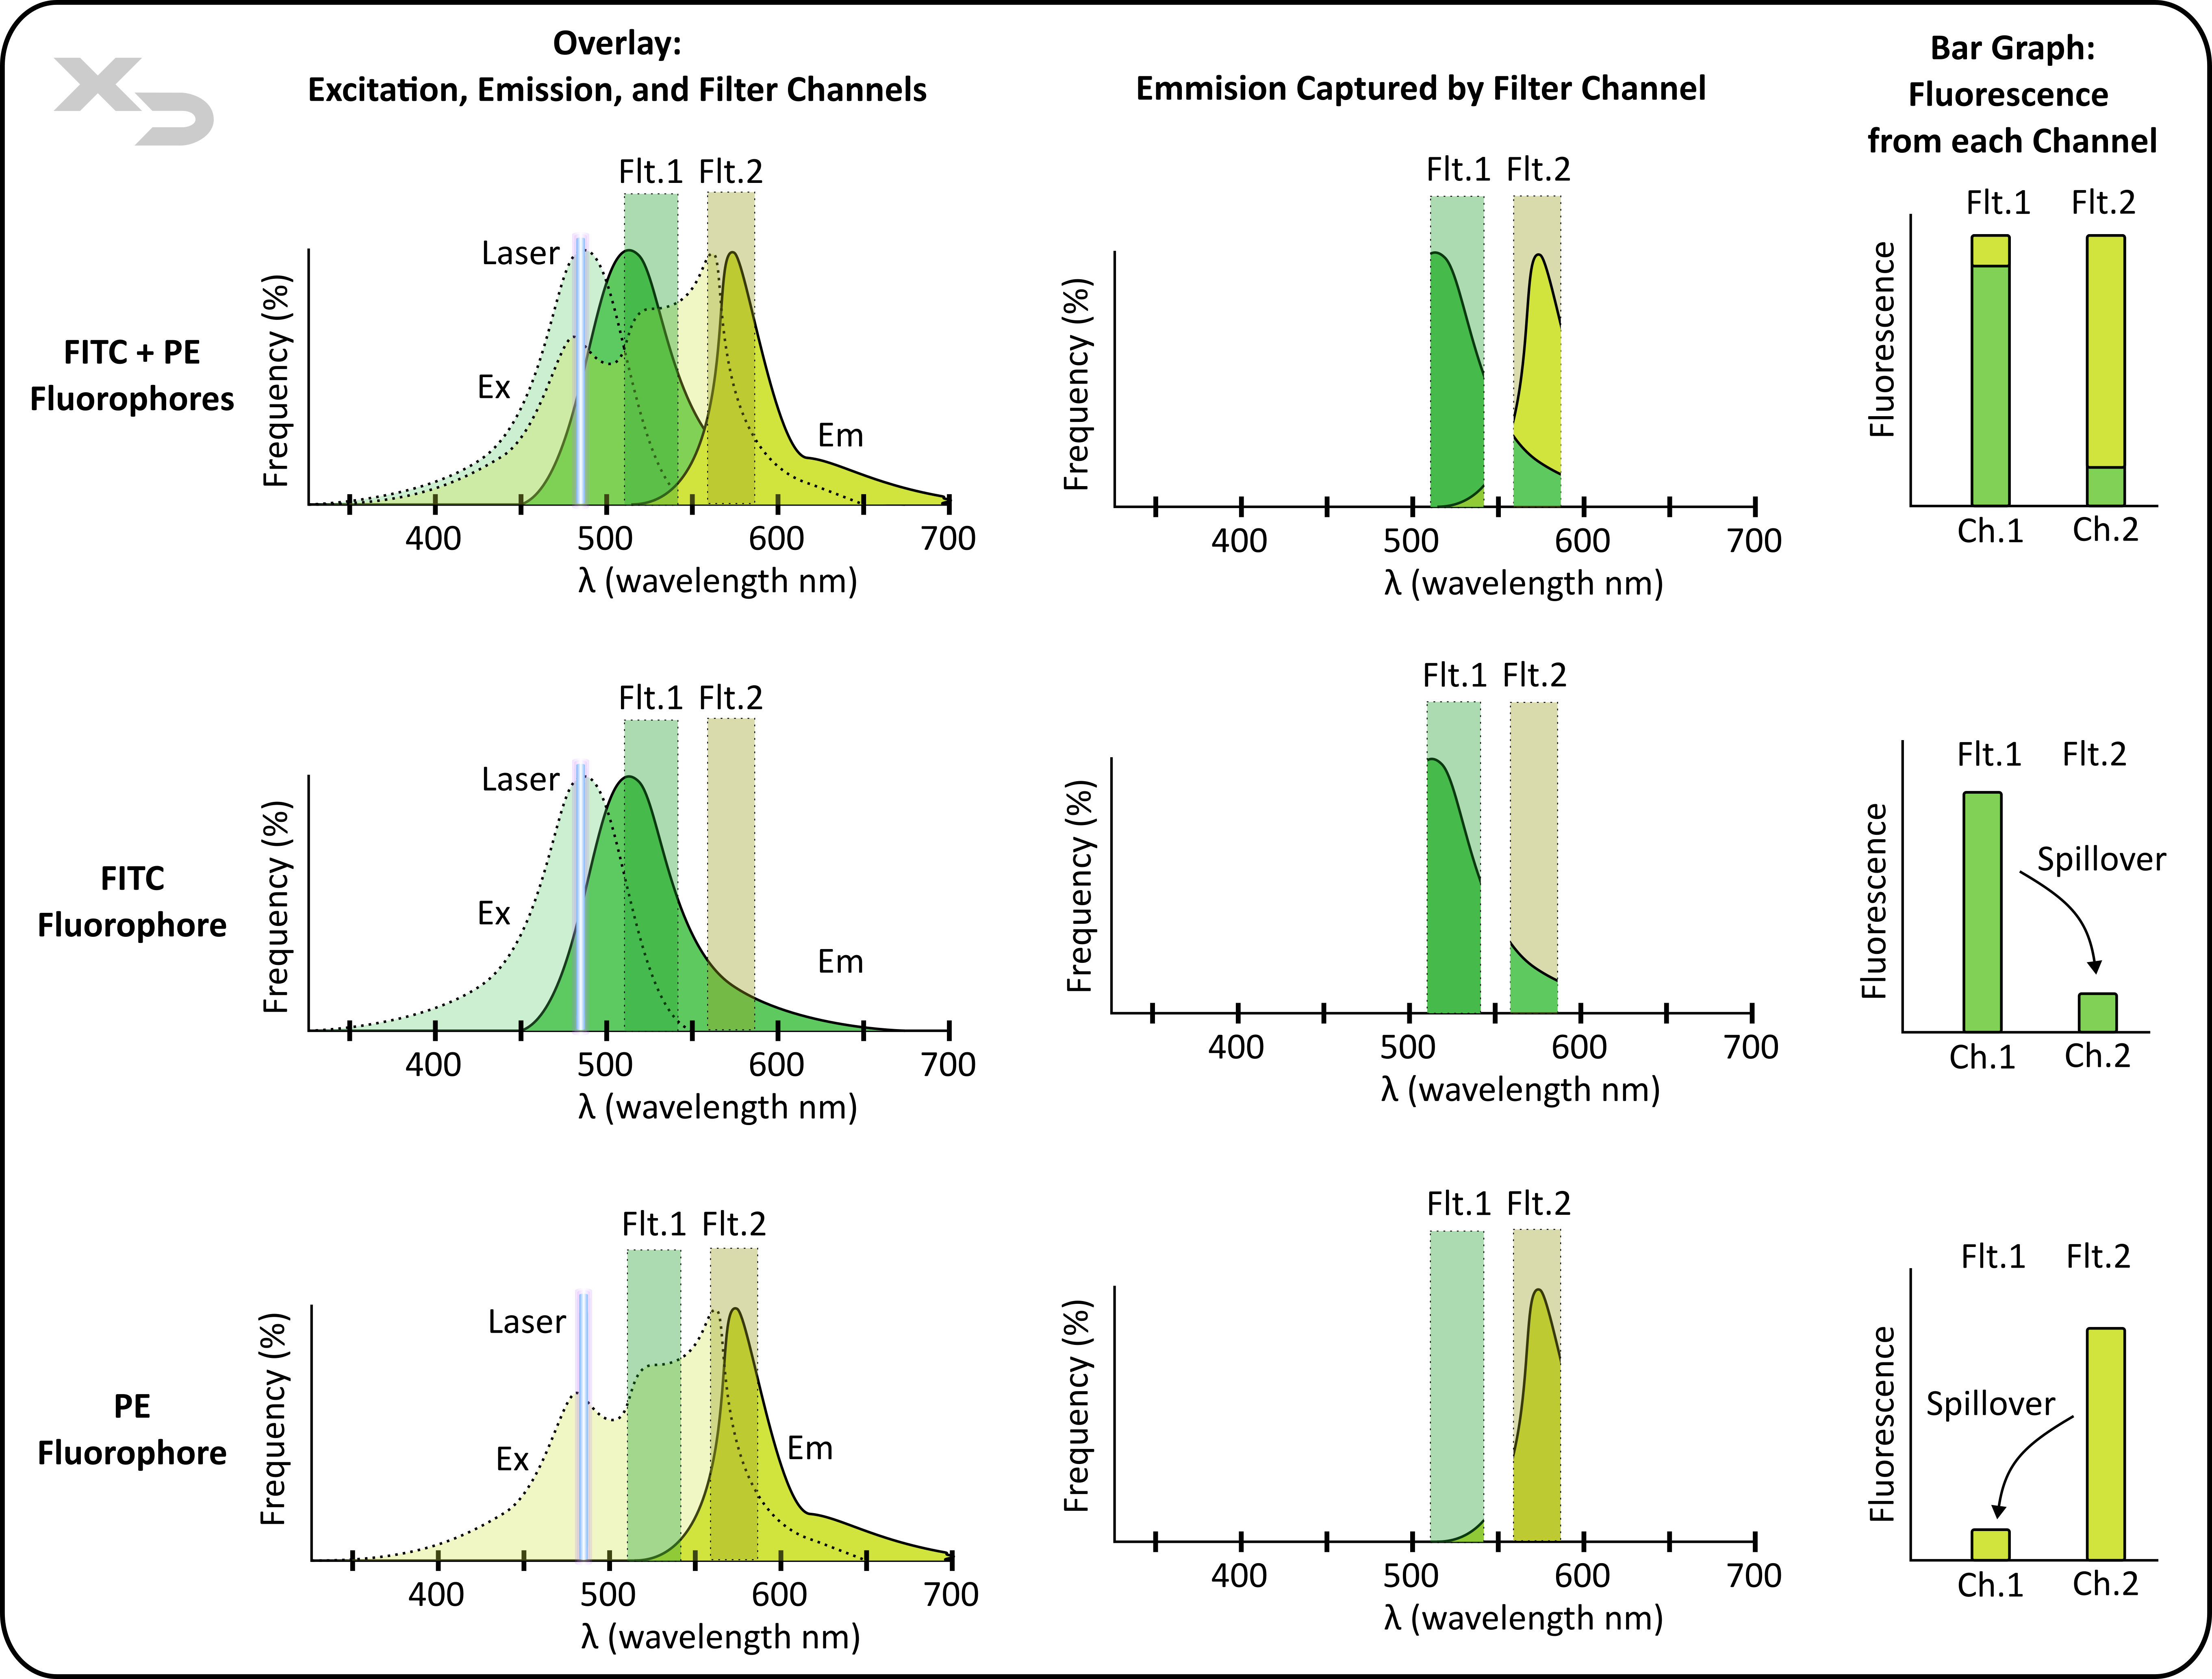
Figure: Illustration of spillover from two fluorophores, FITC (green) and PE (yellow), into two fluorescent filter channels. When used together (top) the detected fluorescence in each channel is confounded by spillover; while the graphic has color-coded the contribution of each fluorophore, in reality only the total fluorescence is measured and the actual ratio contribution of each fluorophore is unknowable without first performing compensation analysis. Compensation analysis (middle and bottom graphs) is shown for FITC and PE individually.
When analyzing compensation, the amount of fluorescence spillover will always be a fixed ratio (percentage) no matter how strong the fluorescence is. In other words, the emission spectra stays the same and is independent of signal strength (fluorescent intensity). For example, in the figure below, the green fluorophore’s spillover into filter channel #2 is always 10% of the signal in filter channel #1, regardless of either a strong or weak emitted intensity.
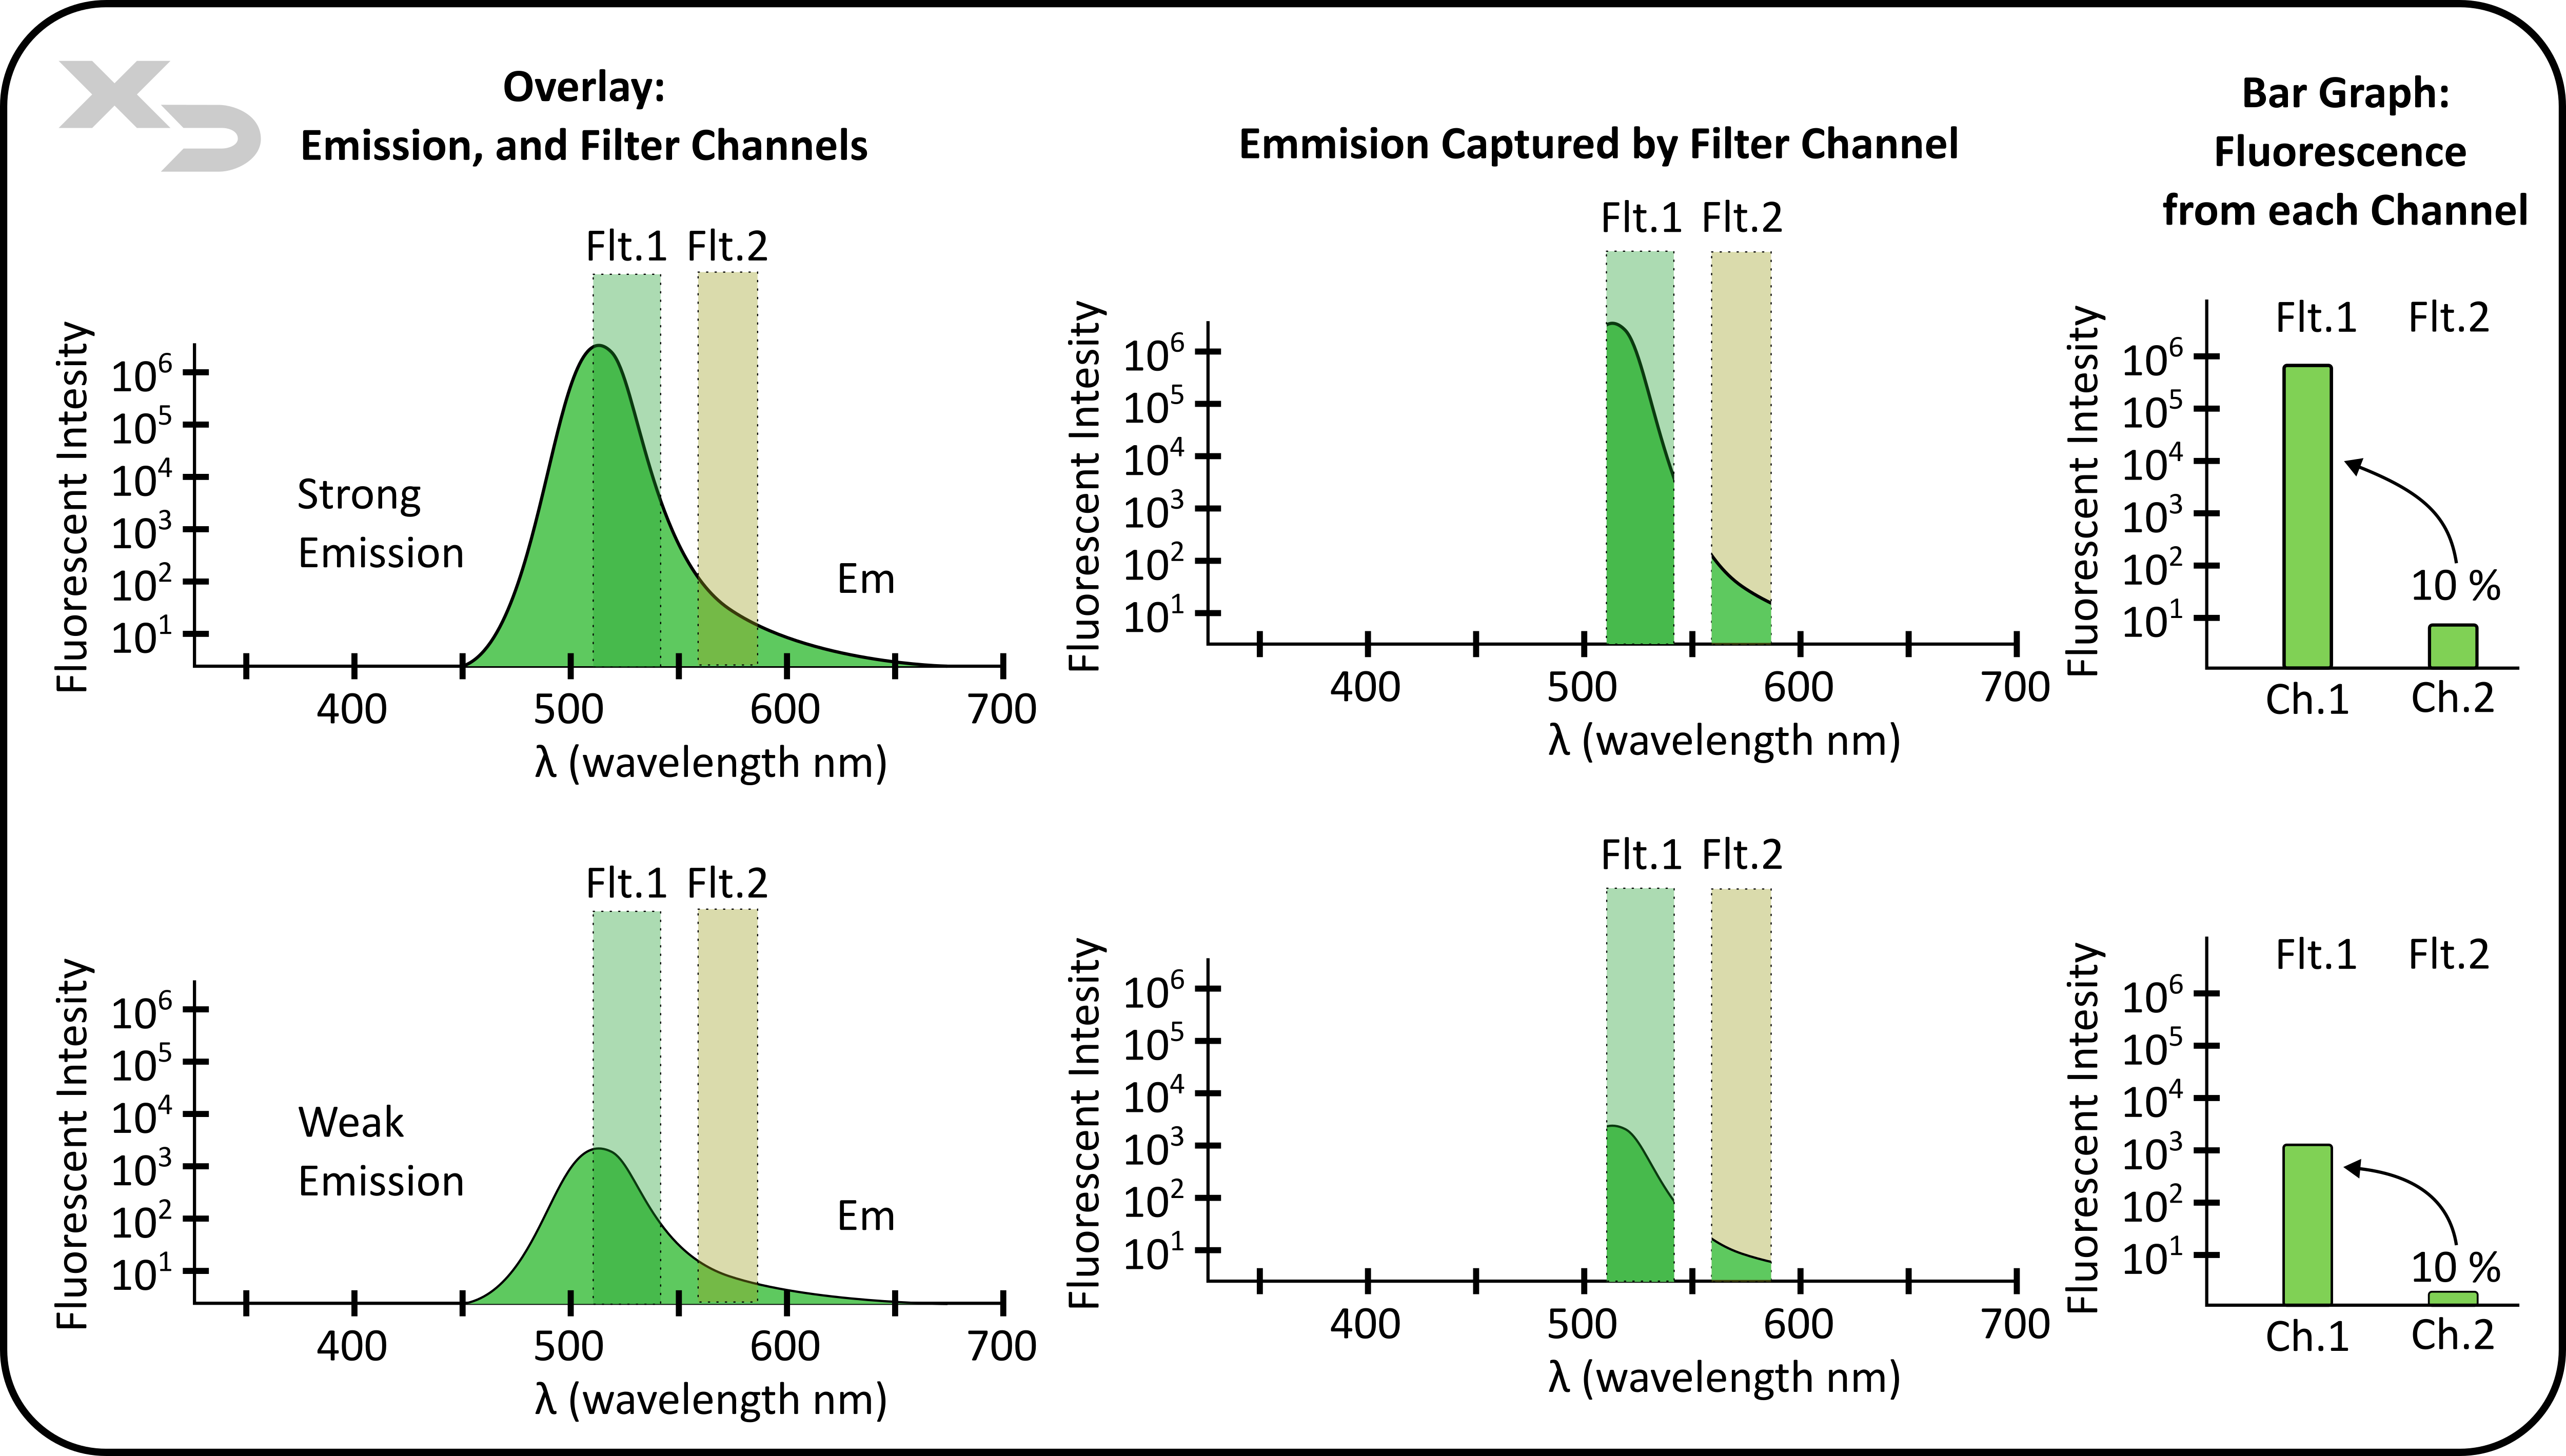
Figure: FITC Emission detected by two (or more) filter channels is will always remain as a percent ratio of the total fluorescence observed, regardless of total fluorescent intensity. In this theoretical example, the fluorescent signal in channel #2 is always 10% of the signal in channel #1, no matter if the initial emission was strong (top) or weak (bottom).
By assessing each fluorophore’s individual contribution/spillover to each fluorescent channel, you obtain a matrix of spillover coefficients that can be used to calculate and correct the data. This is almost always performed automatically by the instrument’s analysis software.
While panel design software can predict spillover to a degree, it is still best to empirically measure it on your instrument for each experiment. Compensation is often performed by either using cells with only a single stain, or by using compensation beads. Compensation beads are commercial products specifically designed to bind an antibody stain, and are easier to use than cells (especially if the desired cell-type for the antibody marker is rare). However, care must be taken to verify that the compensation beads will bind to the species and isotype of antibody chosen for use. Compensation beads will not bind to other non-antibody dyes (viability dyes, proliferation dyes, etc); additionally, compensation beads are not suited for use as an unstained control where the goal is to measure autofluorescence of the cells.
Fluorescent Channels
Flow Cytometry instruments often advertise that they are capable of multi-color use. What is actually being referred to is the number of fluorescent channels an instrument has, which is determined by the combination of lasers and detectors.
This is illustrated in the example below: a 5-color instrument which has three lasers and two filters. Because the lasers are physically separated (parallel), there is a time delay between each signal, as the cell sample takes time to flow past each laser individually. The light-path of the fluorescent emission from each laser excitation will pass through the same set of filters, and to the same set of detectors, but because there is a time delay in signal, the detectors can differentiate which fluorescent signal came from which laser (see our webpage “Fluidics and Optics” for a more detailed schematic). This allows for each laser in this scenario to utilize their own unique fluorophore for each filter.
Both the violet laser and the blue laser can produce a signal for both filters; resulting in channels: ch.1 (violet laser + flt.1), ch.2 (violet laser + flt.2), ch.3 (blue laser + flt.1), and ch.4 (blue laser + flt.2). Only the red laser cannot use both channels. A fluorophore’s emission must be lower energy (longer wavelength) than its excitation. Because the red laser’s wavelength is already so long, it cannot cause emission in the first filter (flt.1) which is at a much shorter wavelength; therefore, the red laser has only a single filter it can utilize.
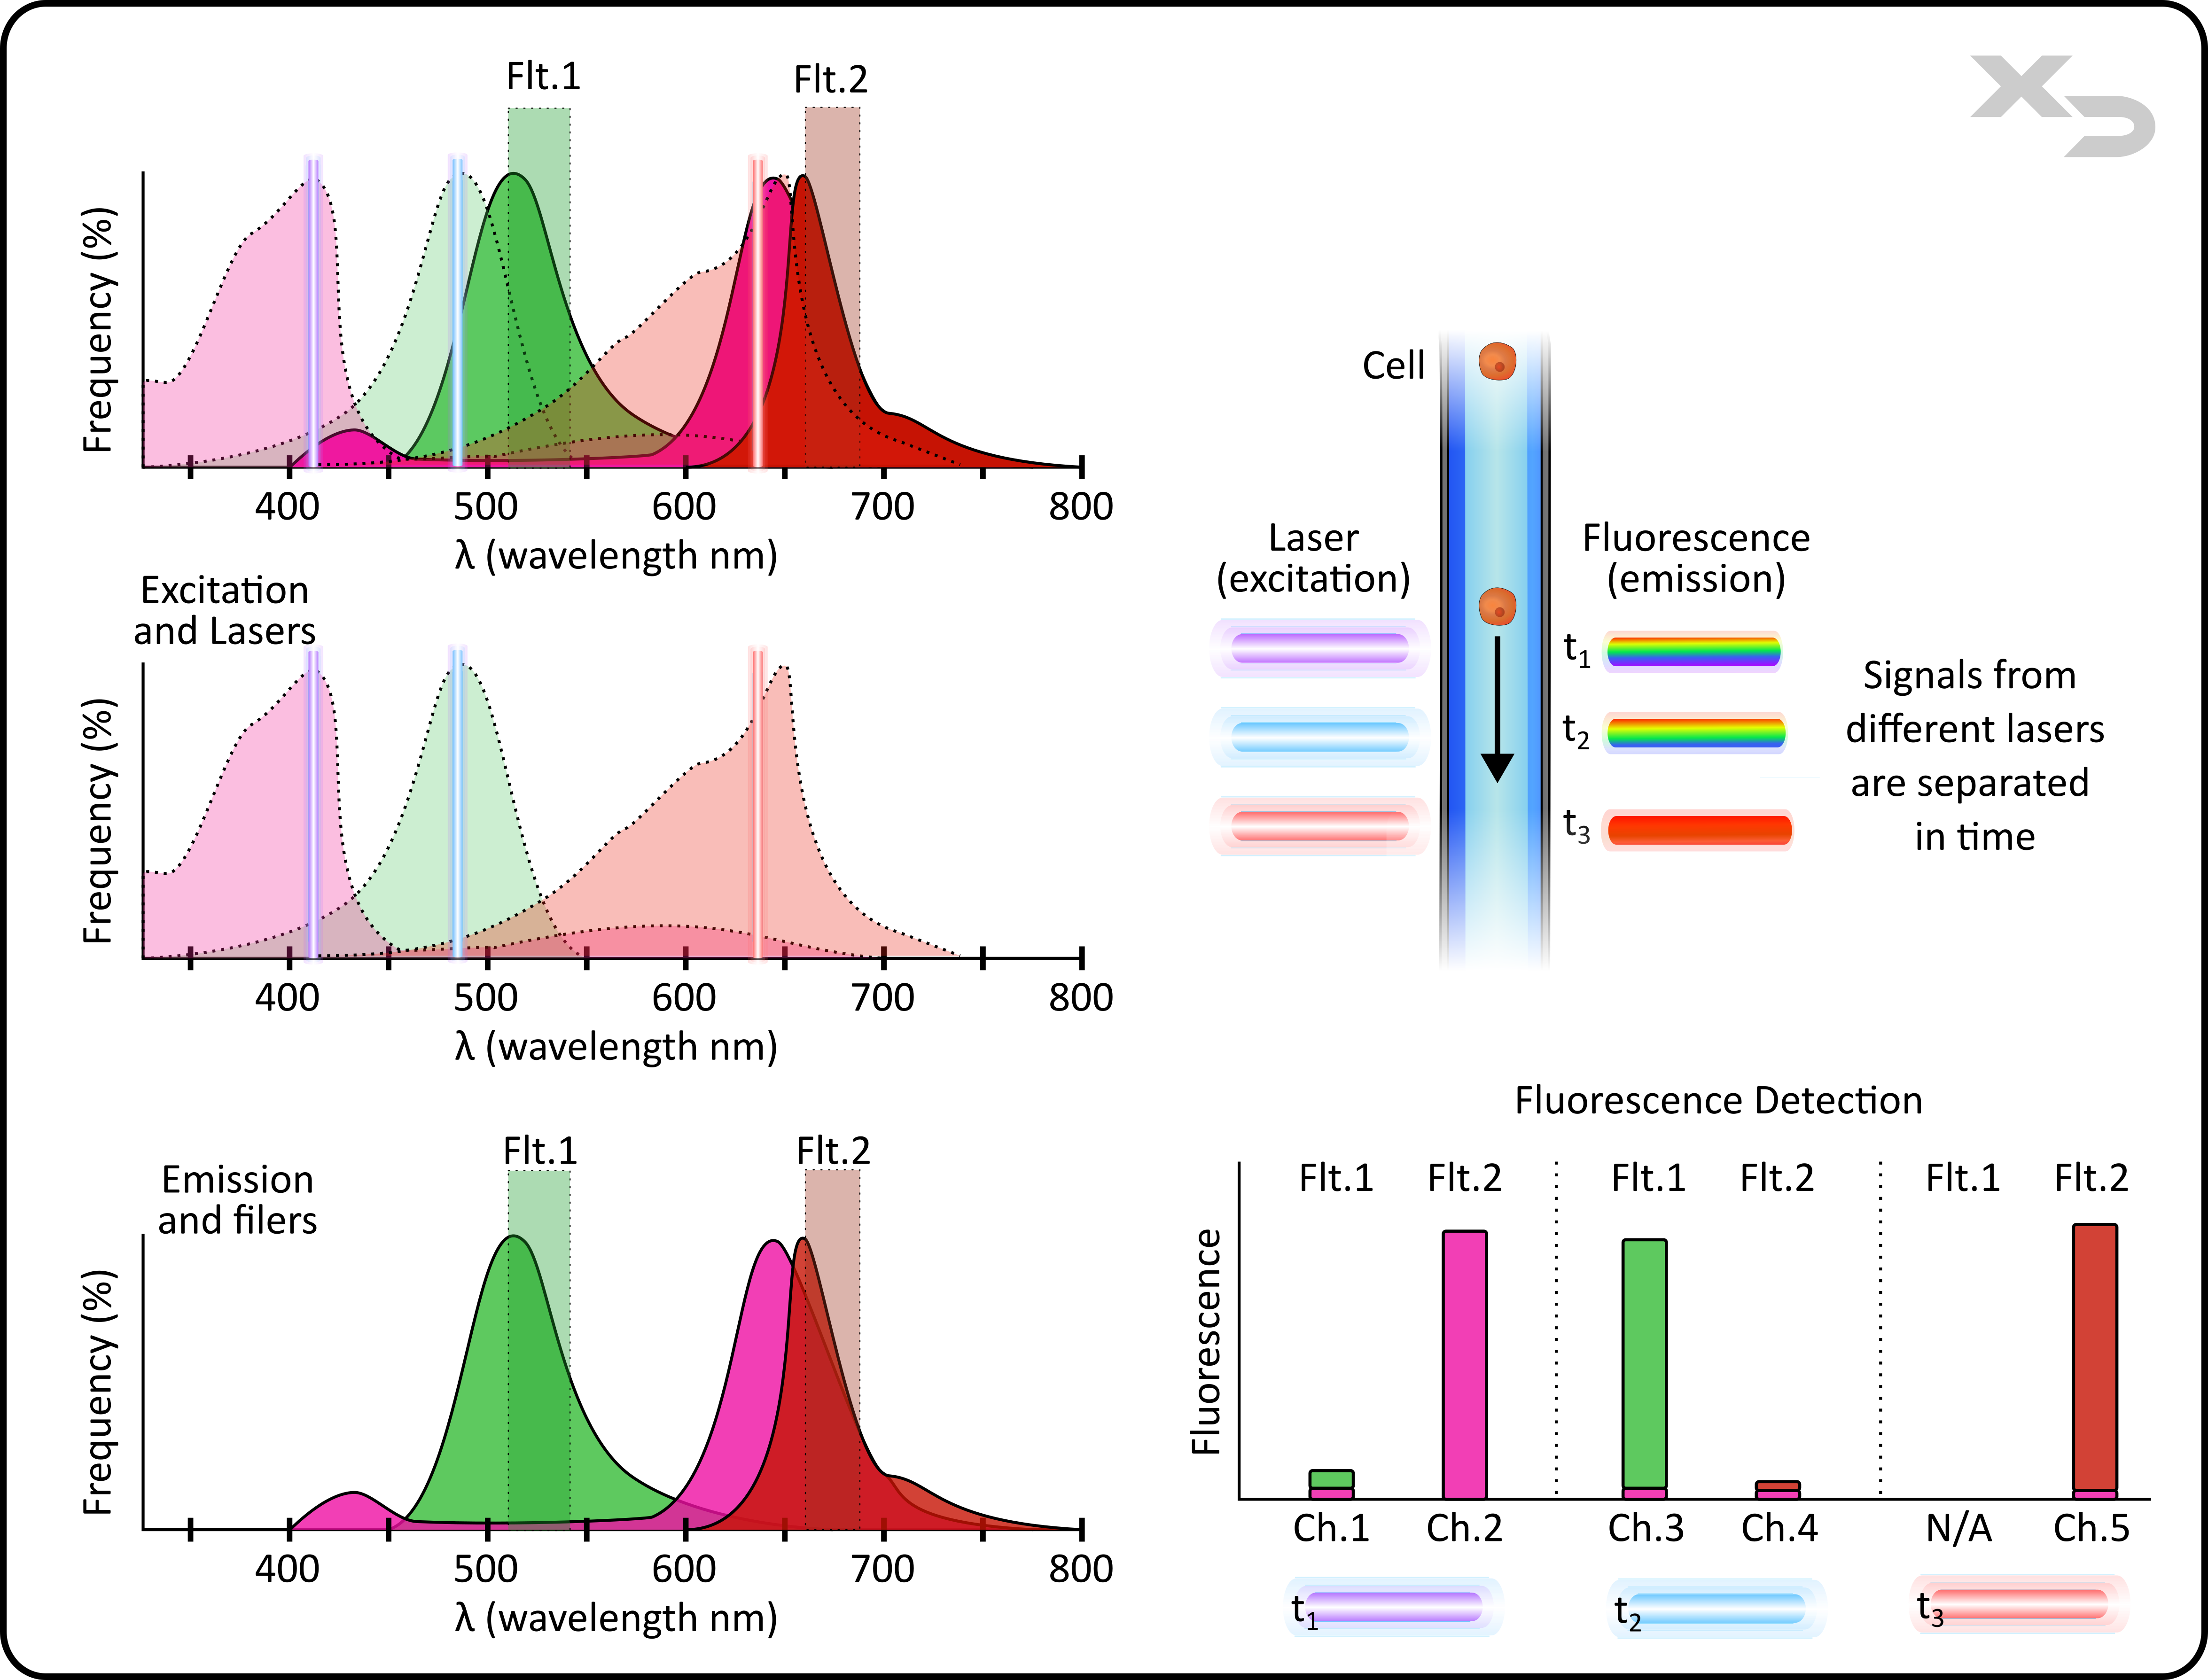
Figure: Signals from different lasers are separated in time. Excitation from each parallel laser allows for differentiation in fluorescent signal, even when the emission light-path utilizes the same filters and detectors. This example illustrates a 3-color experiment on a 5-color instrument. Spectra graphs (left) show combined and individual components of excitation and emission. Graph (lower right) shows filter and laser combination to produce each fluorescent channel. Note: this isn’t the case for all instruments, some instruments have separate dedicated detectors for each laser.
Types of Fluorescent Dyes
There are several types of dyes (aka probes), as well as differences in how they are used. The most common dyes used in flow cytometry include: small molecule probes, large molecule dyes, tandem dyes, quantum dots, and polymer dyes; however, this is not a complete list.
Small Molecule Probes
Small molecule probes are just like they sound, small molecular organic compounds that are typically around 1,000 Daltons (molecular weight) or less. Because small molecule fluorescent properties come from the structure of their bonds, they are resistant to fixatives like paraformaldehyde and methanol which are often used for intracellular flow cytometry staining. Briefly, small molecule dyes include compounds like: Alexa Fluors, FITC (fluoresceins), rhodamines, Cy3, Cy5, Cy7, propidium iodide, 7AAD, and BODIPYs among others.
Large Molecule (protein) Dyes
Fluorescent protein probes are both naturally occurring and recombinant proteins whose primary, secondary, and tertiary structure allows for the formation/reaction between several amino acids in the hydrophobic inner regions of the protein to produce a chromophore capable of fluorescing. However, because fluorescence depends on tertiary structure, the use of fixatives (for intracellular staining) will alter tertiary structure and stop fluorescence. The exact amount of fixative a protein dye can tolerate before it loses fluorescence varies between fluorophores and the type of fixative.
Historically, green fluorescent protein (GFP) was discovered in the 1960’s, naturally occurring in jellyfish. After isolation and decades of study, modifications were made to the protein to alter its fluorescent spectra to produce blue, cyan, yellow, and many other variations. In addition to GFP, many other unrelated fluorescent proteins have been discovered naturally elsewhere, as well as artificially produced. Briefly, protein dyes include proteins like: , GFP, RFP, PE, PerCP, and more.
Tandem Dyes
Tandem dyes are a combination of two fluorophores that are bound together to increase the stokes shift (wavelength difference between excitation and emission). Often, the stokes shift for single dyes is relatively minimal, meaning that the excitation laser and the filter/detector are not often more than 200nm apart. For example, there are no single common small-molecule or protein fluorophores that can be excited by a blue laser (488nm) and detected by a filter at 750nm.
Tandem dyes bridge this florescent gap by compounding two fluorophores together, so that the emission energy of one fluorophore excites the other fluorophore. For example, PE/Cy7: PE is excited by a blue laser at 488nm, and would normally emit at a range of 550-675nm; however, its emission overlaps with Cy7 excitation range of 600-800nm; allowing Cy7 to receive the energy instead and emit at 750-850nm. Thus, the combination of PE/Cy7 was able to be excited at a low wavelength (488nm) and emit at a high wavelength (750nm).
This is a process known as Fluorescence Resonance Energy Transfer (FRET), and is a non-radiative process (e.g. no light is emitted from the first fluorophore, rather it causes resonance between the two fluorophores, allowing the energy to be transferred to the second fluorophore). There is a limit to the distance that FRET can occur (<10nm). Some experiments make good use of this, using an unbound FRET pair which will only fluoresce when the two molecules are close enough together.
Quantum Dots
Quantum Dots are semiconductor nanoparticles with qualities that allow them to luminesce. The physics behind their function are beyond the scope of this webpage. Briefly, in a bulk (large) semiconductor, charges of all energy levels can move freely. However, when that semiconductor is in a small crystalline form, it severely limits where a charge can move to and how much energy that charge can have (quantum confinement). Technically speaking, the size of the quantum dot influences the gap in energy level from ground state to excited. Smaller quantum dots require high energy photons to excite, whereas larger quantum dots absorb less high energy photons. Thus, quantum dots can tune their fluorescence wavelengths by altering their size.
Polymer Dyes
Polymer dyes, also known as π-conjugated polymers, are a classification of polymers with both optic and electrical properties. They have been used for a wide variety of applications such as electronic devices and diodes (ex. OLEDs), as well as for biological applications (ex. fluorophores). Their use as fluorophores stems from their structural property where the bonds between monomers are π-orbitals that allow for electron delocalization, similar to the delocalization seen in small molecule organic dyes. This allows for polymer dyes to tune their fluorescent properties based on how long these delocalized π-orbitals are in the polymer chain.
As these dyes are polymers, they tend to be highly resistant to fixative chemicals and often produce very strong (bright) fluorescence. As such, polymer dyes are one of the fastest growing areas of research for new fluorescent dyes. Briefly, polymer dyes include Brilliant Violet dyes, StarBright dyes, SuperNova dyes, and SuperBright dyes.
How Fluorescent Dyes are used
Conjugated
Conjugated dyes are fluorescent dyes that are physically bound to another molecule. While the most common conjugate is to an antibody, there are other conjugates such as lipids, proteins, DNA, and other biological molecules of interest that can be bound with a fluorescent tag.
Conjugation is most often performed using maleimides to bind cysteine (SH; sulfhydryl) amino acid residues or succinimidyl esters (NHS) to bind lysine (NH2; amine) amino acid residues. Conjugation (click) chemistry is a vast field and many other chemistries exist including , CuAAC, and SPAAC to name a few.
Un-conjugated
Fluorescent dyes for flow cytometry can be used alone without conjugation. Dyes are often only conjugated because without a conjugate like an antibody, they cannot be used to target a cellular component of interest (e.g. surface or intracellular marker). But this is not true for dyes.
Some dyes like propidium iodide (PI), 7AAD, and Hoechst work because they bind/intercalate to DNA and or RNA in the cell.
Other dyes, like calcien AM, are colloquially called enzymatic dyes, because while they are small molecule dyes, they only fluoresce after being enzymatically cleaved by esterases in the cell. The fluorescent product is then retained within the cell.
There are also dyes that are meant to be conjugated during flow cytometry staining. For example, proliferation dyes like CFSE (carboxy fluorescein succinimidyl ester) are FITC dyes with a succinimidyl ester conjugation chemistry attached. The dye is membrane permeable and migrates into the intracellular space where it conjugates to any and every protein that has lysine amino acid residues. This is also why these dyes have to be stored in non-aqueous solvents (e.g. DMSO), as the conjugation chemistry groups will hydrolyze in aqueous buffer after only a couple hours.
Recombinant Promoters/Reporters
GFP, and similar protein dyes, are also known as reporter dyes. This is because they can be recombinantly expressed in transgenic animal models. Dye production can be tied directly to a cellular target, or cellular process, and fluorescently “report” without need for staining.
For example: a mouse model with a GFP linked IFN-γ cytokine reporter can be used to assess T-cell activation. When the T-cells are unstimulated, there is no IFN-γ produced, and thus no fluorescence. Yet when T-cells are stimulated they produce GFP fluorescent IFN-γ, and the fluorescent intensity is proportional to the amount of IFN-γ produced.
Antibody Selection
While fluorophores can be used on their own, or conjugated to another biomolecule, by far the most common configuration for flow cytometry is to be conjugated to an antibody. This is because antibodies are incredibly versatile. Antibodies can be highly specific for single targets (monoclonal) or even regions of a target (epitope). As such, antibody selection plays an important part when designing a flow cytometry panel. The info below will cover the major aspects that should be considered when selecting an appropriate antibody reagent for an experiment.
Target and Host Species
Antibodies are specific in that they are directed to bind a single specific target or group of targets. The specificity is often precise enough to differentiate similar targets from different species (e.g. human CD3 T-cell from mouse CD3 T-cell). As such, it is critical to verify that the selected antibody for an experiment is targeted to the species that will be used in the study.
All antibodies have a “host” species, even if they were produced recombinantly from a bacterial culture. This is because the original isolated antibodies were derived from an animal species, and the sequence and structure of the antibody is maintained even when produced recombinantly. Although it should be noted that if not produced in a mammalian cell line like CHO or HEK293 (e.g. instead produced by bacterial culture) then the antibodies may lack specificity or have altered post-translational modifications like glycosylation that are unique to the expression vector. Typically, the antibody host species is not a critical factor in the selection of most antibodies unless a secondary antibody will be used.
Clone
Antibody clone refers to which cellular clone the antibody was originally produced from. Antibodies (immunoglobulins) are produced by B-cells. Every B-cell has a unique re-arrangement of the genes used to produce antibodies. A single B-cell clone will always produce the same antibody for a specific antigen target. This is part of why our immune system is so adaptive, as through B-cell immunoglobulin gene rearrangement our bodies have the potential to produce antibodies against any foreign antigen imaginable.
Technically, the specificity for a target antigen is actually a region of its surface, known as an epitope. As any antigen has a number of unique surface features (epitopes), antibody clones can distinguish between them. For example, in phospho-flow, two different antibody clones can be used to target the same antigen but for different locations where phosphorylation has occurred. In practice, antibodies come as either monoclonal (specific for a single epitope) or polyclonal (specific for multiple epitopes on a single antigen).
Different clones will have different characteristics such as affinity/avidity, cross reactivity, and steric incompatibilities. The first two, affinity and cross-reactivity are straightforward: the antibody clone (and thus its structure) will differ from other antibody clones. As such its binding strength (affinity) and specificity (cross-reactivity) will vary. Steric compatibility comes into effect when an antibody clone may block binding of another antibody or molecule (e.g. drug) to the target, either because the antibody has already bound to the epitope that the molecule is targeting, or because the epitope location is close enough to the other epitope to block it. This is often a desired trait for some monoclonal therapeutics, as they bind to a cell receptor (without activating it) and block the receptors substrate from binding and activating.
Fixed Targets and Applications
When selecting an antibody, it is important to determine if the target will be fixed (e.g. with paraformaldehyde). Fixation often disrupts the tertiary structure of a protein target and can alter the binding epitope so much that the antibody is unable to bind it. The degree to which the epitope is altered depends on the type and amount of fixative used. As such, some antibodies can bind lightly fixed targets, but fail when the target is heavily fixed (e.g. harsh fixatives for applications like phospho-flow).
This is why antibodies are often listed to have verified applications. Traditional flow cytometry (FC) application assumes no fixative was used, whereas intracellular flow cytometry (ICFC) does assume fixative was used. Even then, some vendors take it a step further and report the degree to which the antibody can still bind to targets at different levels of fixation.
It is important to choose an antibody that has been verified for use in the desired application, as not all FC antibodies will work for ICFC, and vice versa.
Primary and Secondary
A primary antibody is an antibody that binds directly to a specific target. Often the primary antibody is available with a fluorophore (or other reporter molecule) already conjugated. However, on occasion only an unconjugated antibody may be available. In order to detect the target of interest, a secondary antibody will have to be used.
A secondary antibody is an antibody that targets another anybody. In this case, the secondary antibody will have a fluorescent tag, and will target the primary unconjugated antibody. Secondary antibodies target primary antibodies by binding to their FC region (tail-region) which is a conserved region (e.g. no gene recombination). As such, secondary antibodies can only identify primary antibodies by their host species.
If using a secondary antibody, it is important to make sure that you are not using any other primary antibodies with a host species that the secondary antibody targets, except for the primary antibody of interest.
Fluorophore Selection
In order to choose the correct fluorophore, the rest of the information (above) on this webpage should be considered: excitation, emission, and spillover as it pertains to your instrument’s configuration. Often, depending on the antibody selected, there may not be many options for fluorophores. As such, it can take time going back and forth with antibody/fluorophore selection to find the right combination that is appropriate for the flow cytometry panel.
Careful consideration should be made when purchasing custom conjugated antibody reagents. In cases where routinely produced antibody-fluorophore combinations are not available, some vendors may offer to perform custom conjugation for an additional fee. It is important to note that the conjugation process can alter the antibodies functional characteristics (e.g. affinity), and so care should be taken to ensure either the vendor or end user verify the performance for its intended application prior to use.
We have designed several informational pages with custom graphics to help explain the complex concepts of flow cytometry.
"*" indicates required fields
Copyright © 2021. All rights reserved.
