
How are Flow Cytometry Events Collected?
The two most common types of detectors are photodiodes (PD) and photomultiplier tubes (PMT). In essence, both translate photon detection into a voltage output, however their mechanisms and uses differ. PD’s are simple inexpensive detectors that directly translate detection into a signal using a diode, consisting of a cathode/anode that excites when the anode is struck by photons. However, the resulting output voltage from a single photon is functionally undetectable, making PD’s a poor choice when trying to measure very dim fluorescent signals. This is why PMT’s are often preferred, as they amplify the signal from a single incident photon. The amount of amplification (gain) can be tuned by adjusting the voltage applied to the PMTs.
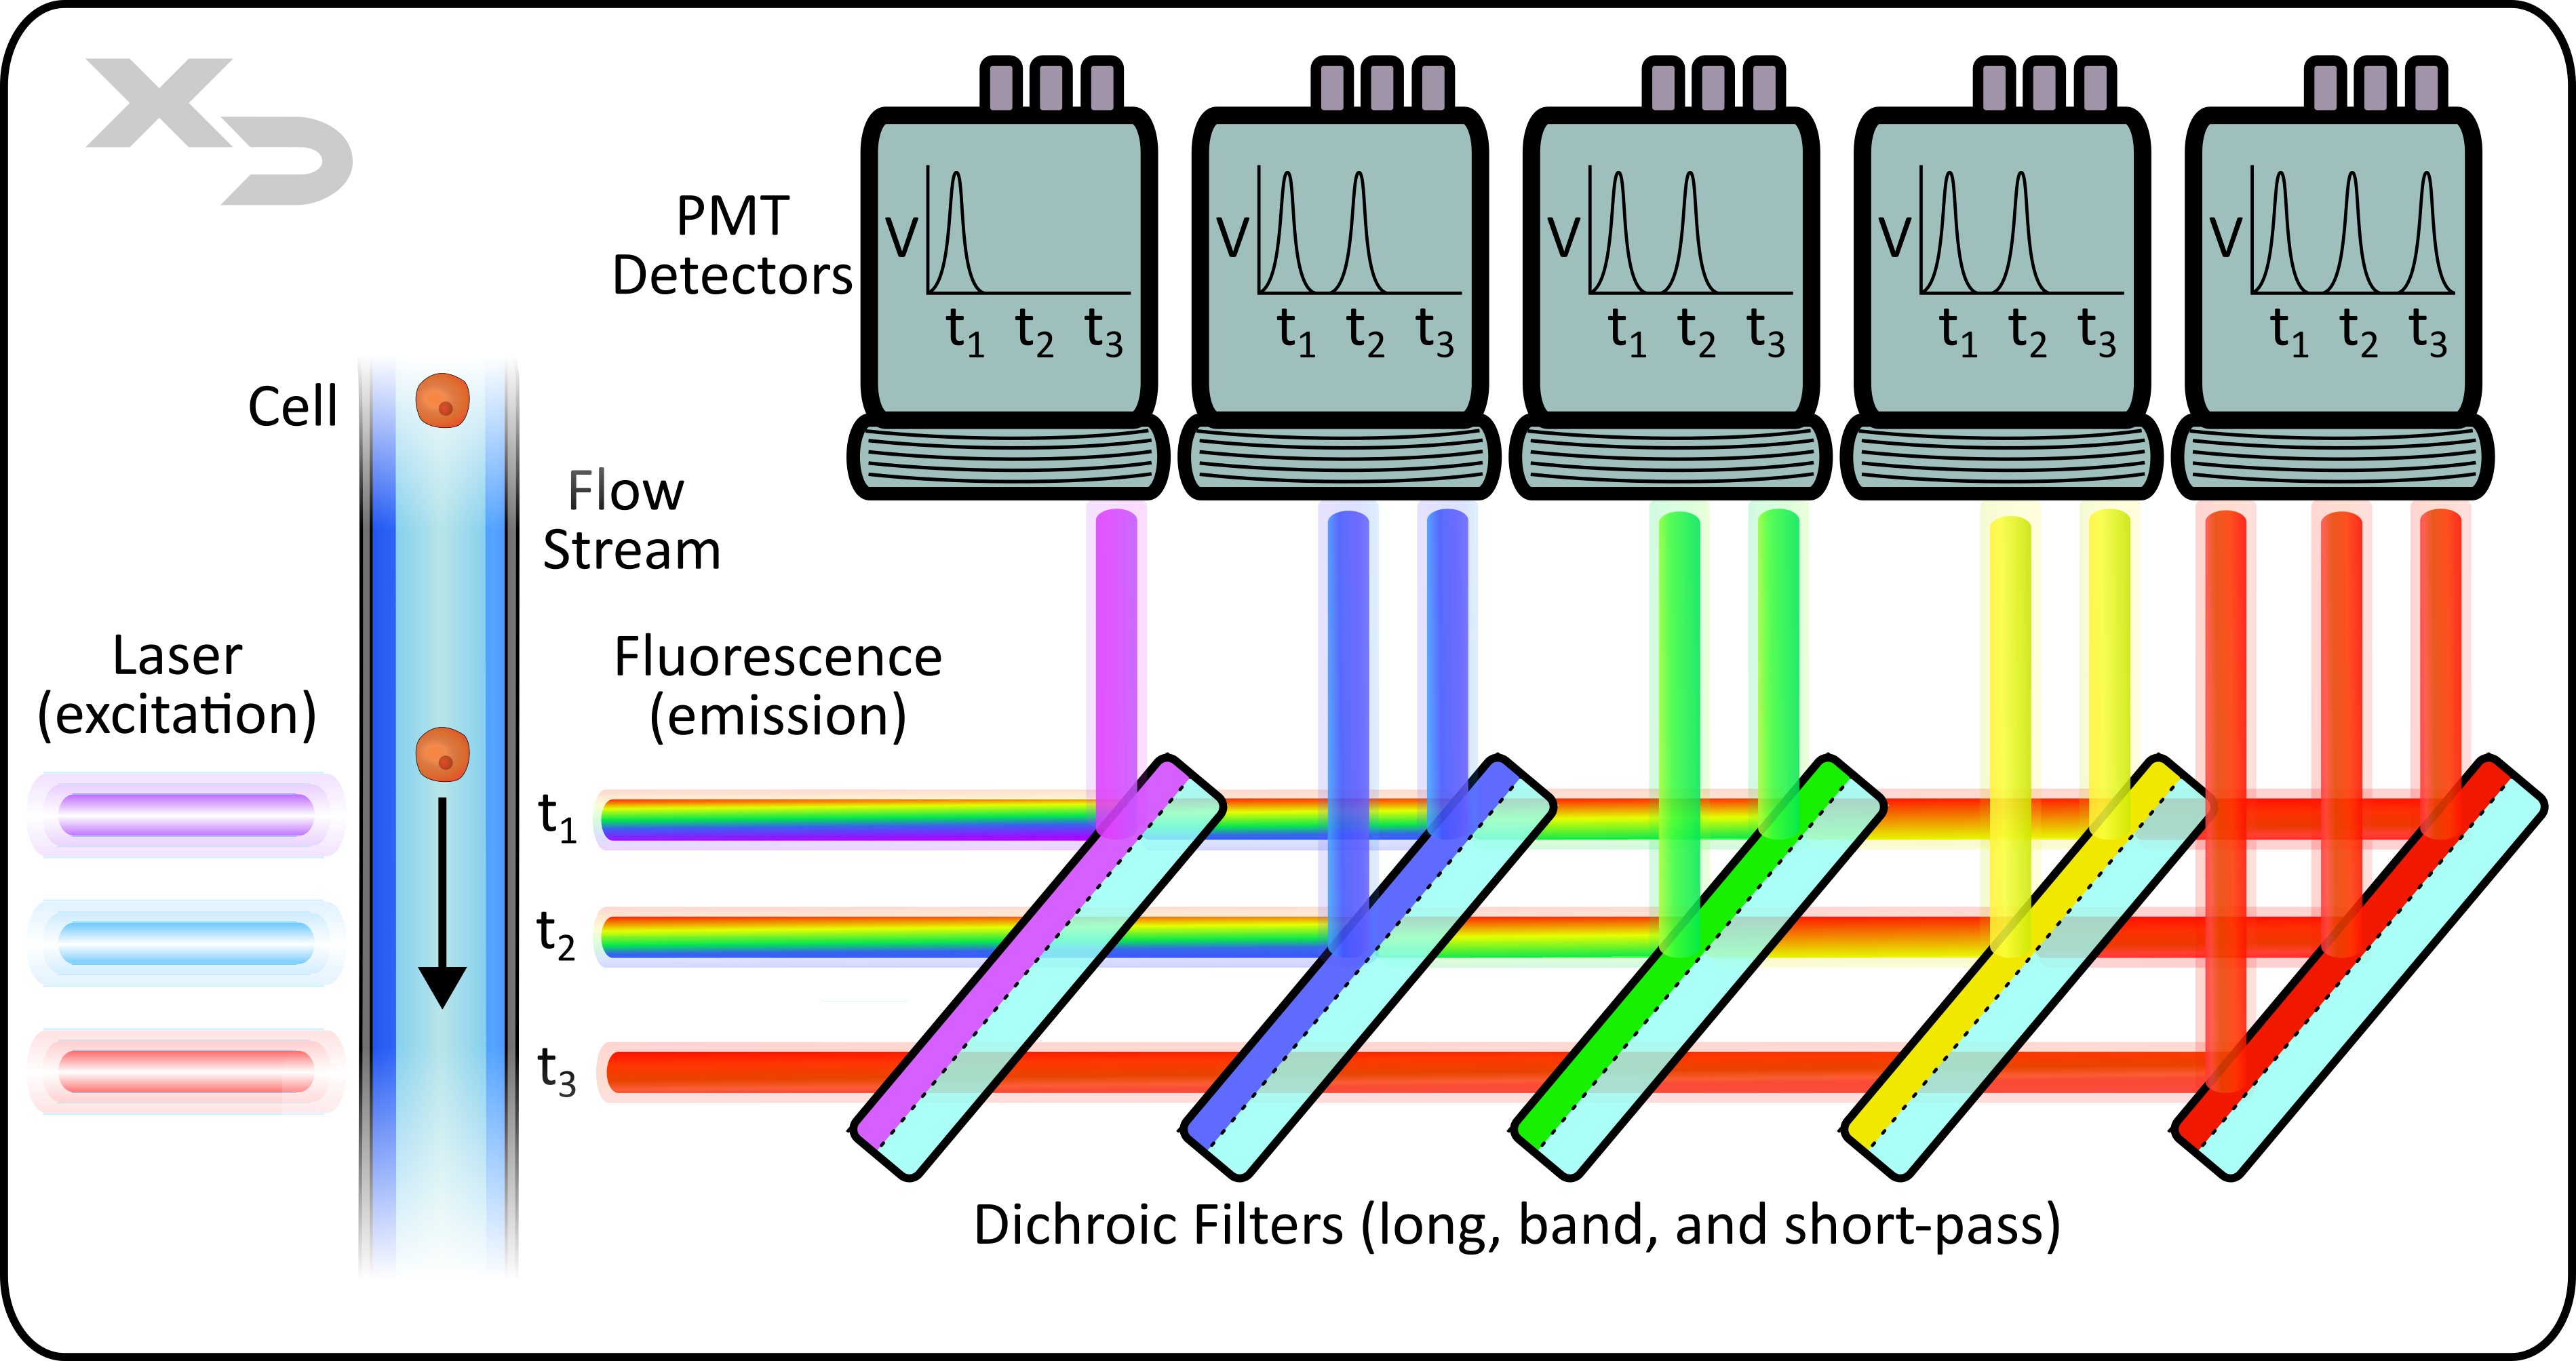
Figure: simplified diagram of flow optics and detection by photomultiplier tubes (PMTs). This example illustrates a 10-color instrument with parallel lasers and shared filters/detectors. Note: emission light path/filters are typically oriented at a 90° angle, perpendicular to laser path. Not shown: forward and side scatter detection.
How does Voltage Adjustment (Signal Gain) Work?
Most flow cytometry instruments require users to adjust the voltage (gain) applied to the photomultiplier tube (PMT) detectors. This allows users to adjust the output signal to either amplify dim stains, or reduce overly bright stains that saturate the detector. The overall goal of voltage adjustment is to maximize separation in fluorescent readout between an unstained (autofluorescent) population of cells and the positively stained cells, without saturating the detector. This is often performed by running a sample and actively monitoring and adjusting the PMT voltage until the desired separation is achieved.
Alternatively, some instruments do not allow for user adjustment of PMT voltage; rather they provide a single moderately high voltage, ensuring that no dim events are lost. To prevent saturation of the detector the instruments are typically designed with sensitive detectors than can span larger ranges (e.g. ~ 7 logs). These instruments offer a more plug-in-play approach to simplify the user experience.
How is Voltage Translated to Fluorescent Intensity?
It is important to note that when discussing voltage and flow cytometry, there are two different voltages: 1) the voltage that is applied to PMT detectors to adjust signal gain, and 2) the output (results) voltage signal from the PMT that is analyzed and correlated to fluorescent intensity.
As a single cell moves across the path of the laser it fluoresces. The emitted fluorescence is detected by the PMTs which produces an analog voltage signal. After the signal passes through an analog to digital converter (ADC) the voltage signal can then be interpreted. As depicted in the figure below, the detected fluorescence, and thus voltage signal, is minimal when the cell first enters the laser’s path. Then as the cell is fully illuminated by the laser it gives off the most intense signal, which then dims as the cell moves out of the laser’s path.
This produces a voltage signal over time, and typically has the appearance of a gaussian/normal curve. Most instruments allow the user to select how they want to correlate the voltage/time signal back to fluorescent intensity. The options are typically peak height (H) of the voltage signal, or to integrate the area under the curve (A).
It should be noted, that while fluorescent signal is being measured over time, this process (in traditional flow cytometers) is different from what is known as “time-resolved” fluorescence, which measures the fluorescence decay rate of a fluorochrome. Time resolved flow cytometers do exist, however they achieve this effect by either pulsing the laser on/off or modulating laser frequency; whereas the lasers in traditional flow cytometers are held constant and do not allow for decay measurements.
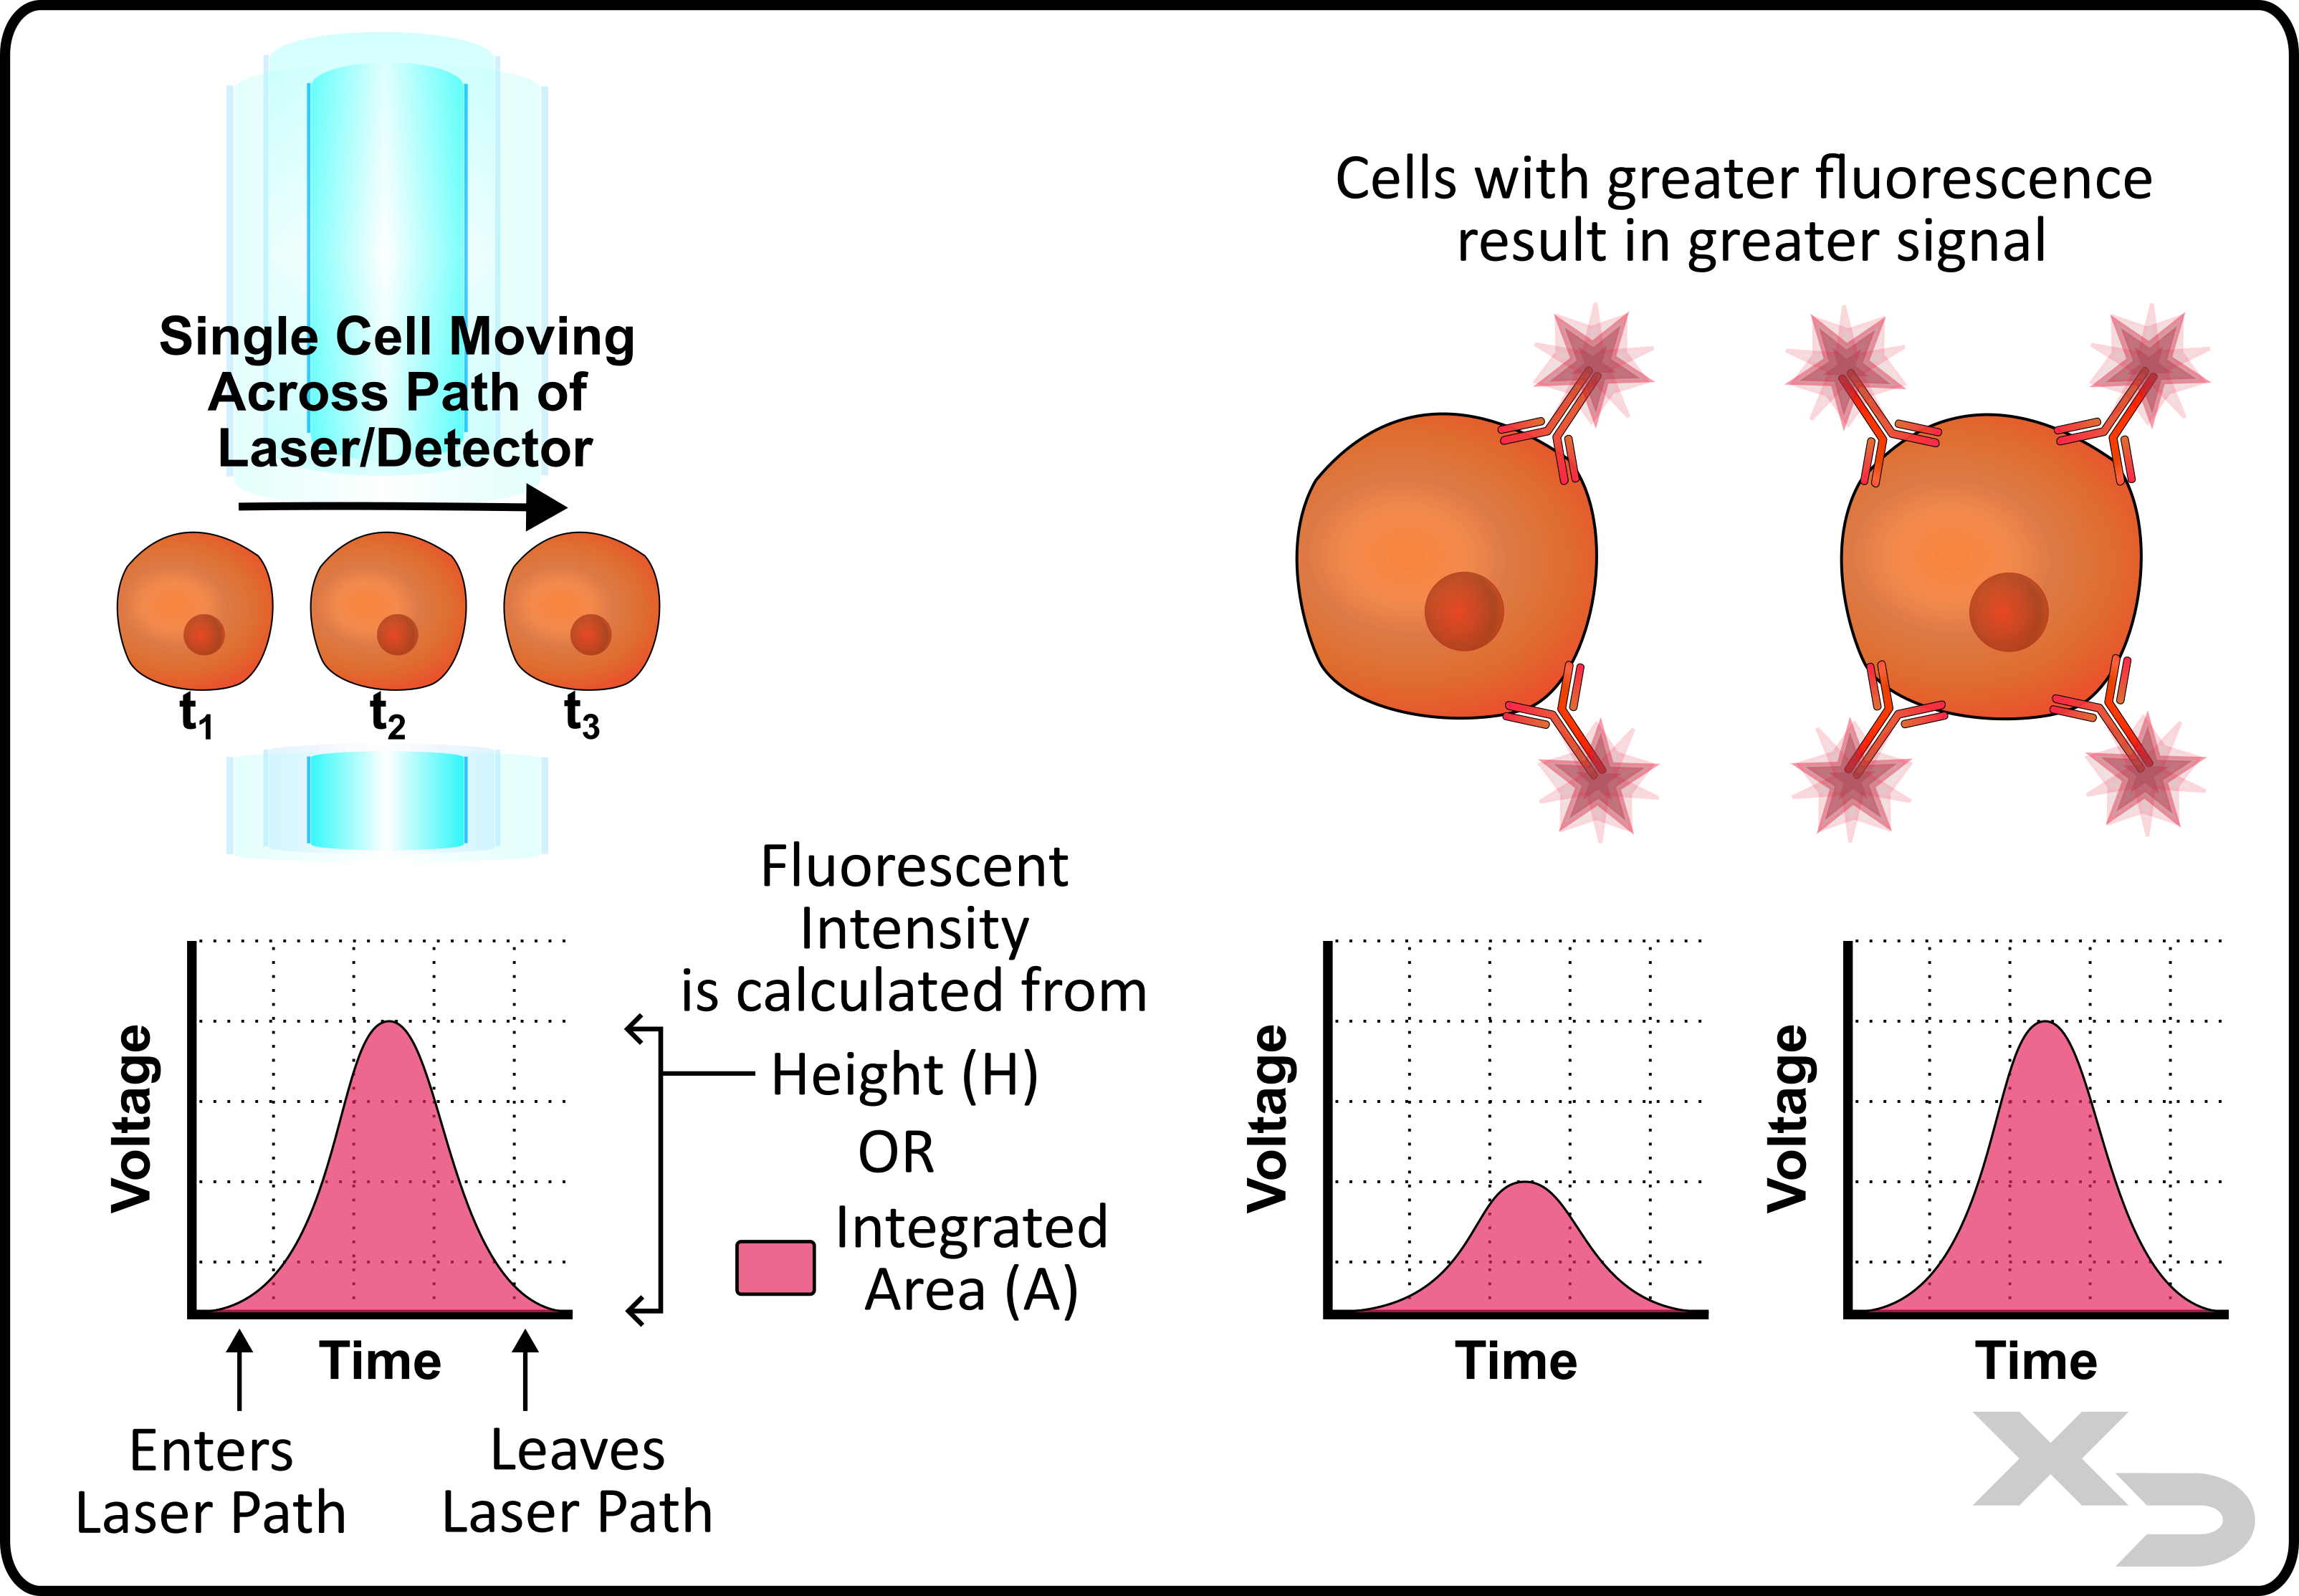
Figure: Depiction of a voltage/time curve for a cell as it passes by a laser. Signal is proportional to the amount of fluorescence detected, and voltage curve results can be analyzed by measuring either peak height (H) or integrated area (A).
What is Forward Scatter and Side Scatter?
Forward scatter (FSC) and side scatter (SSC) are two non-fluorescent measurements that the instrument takes. These two parameters reflect cell size (FSC) and complexity (SSC) and are based solely on how the light scatters off the cells. As the cell moves through the laser’s path, not only does the cell fluoresce (e.g. emit light at lower energy wavelength than the laser) but the cells also scatter the light from the laser.
The laser light illuminates both the exterior and interior of the cell, allowing for light to scatter off the surface of the cell as well as intracellular components. Larger cells have both more surface area and interior volume for the light to scatter off of. This scattering is minimal, only reflecting the light at shallow/oblique angles. The figure below illustrates how the FSC detector picks up the scattered light and how the amount scattered increases with cell size (volume).
Conversely, cells with greater complexity such as organelles, cytoskeletal filaments, etc. cause the laser light to scatter at greater angles. As such, an SSC sensor is placed at a 90° angle perpendicular to the laser light path (note: SSC light path is often the same path for collecting fluorescent emissions).
The combination of being able to measure both cell size and complexity allows for the differentiation of broad cell types without any fluorescent markers. The figure below indicates the regions for which common cell types in PBMCs can be found based on FSC x SSC scatter data.
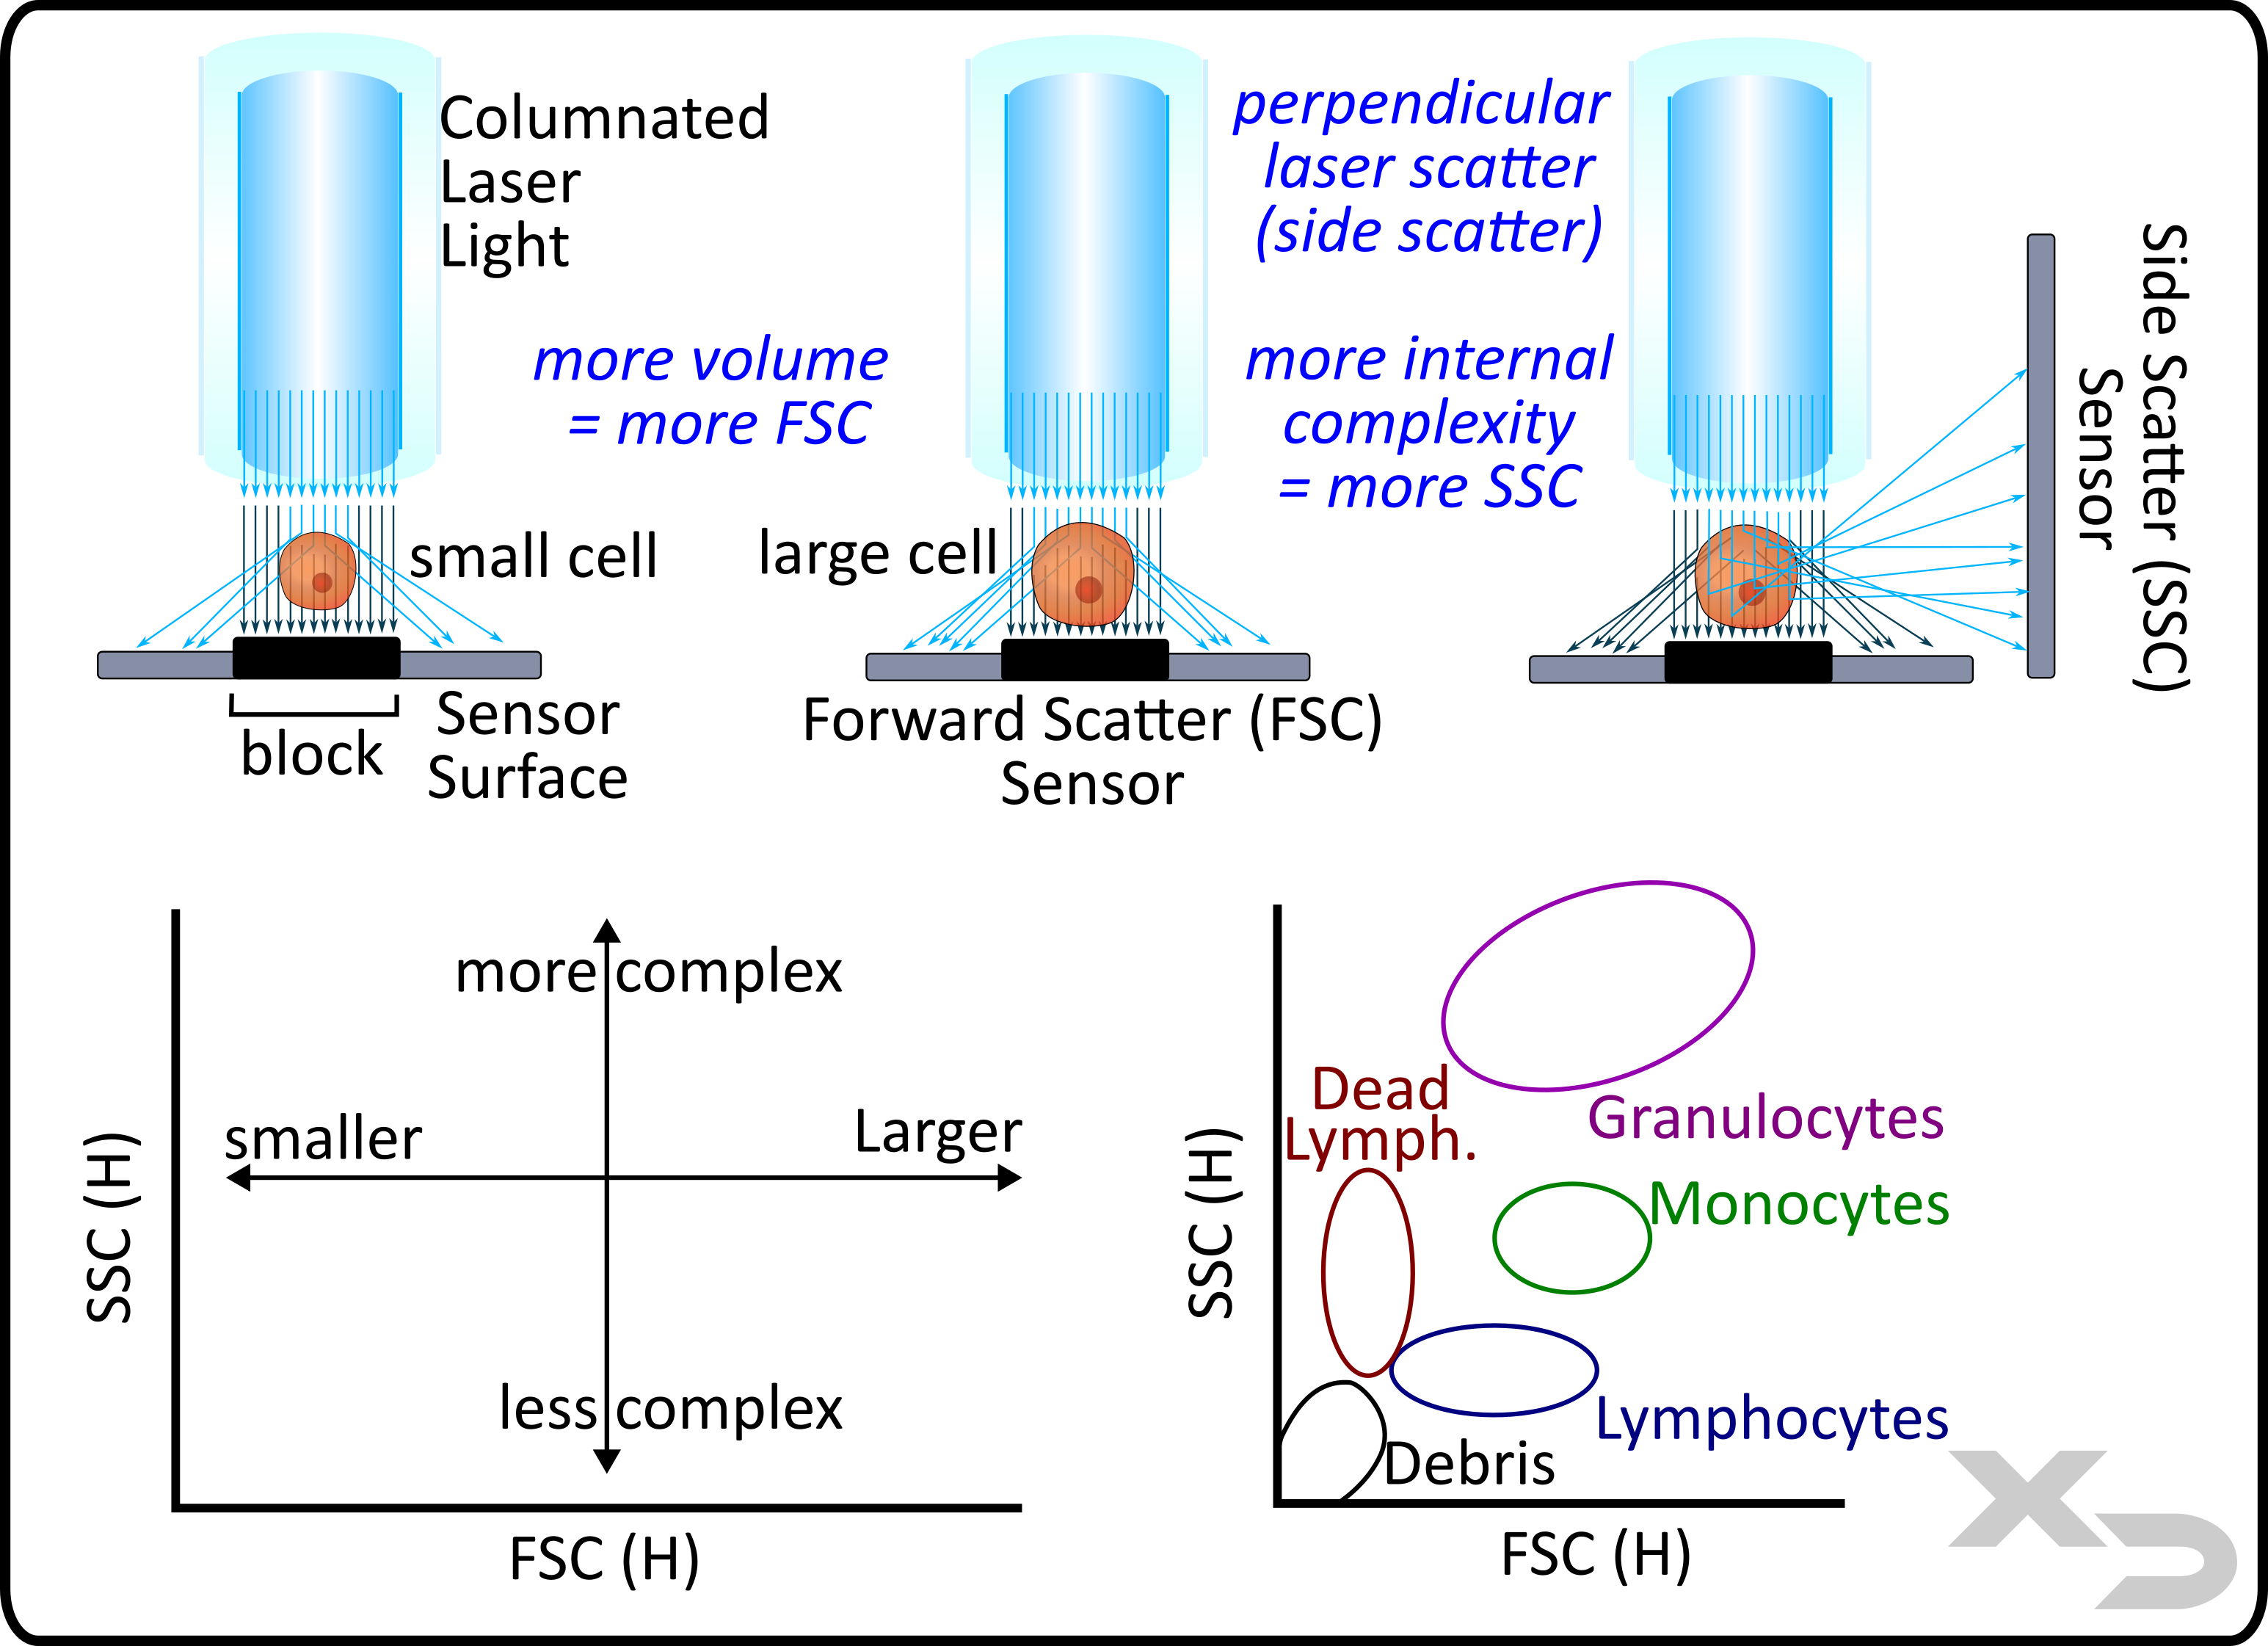
Figure: Illustration of forward scatter (FSC) and side scatter (SSC) light collection and how it relates to cell size and complexity respectively.
How are Single Cells Differentiated from Multiple Cells?
The goal of flow cytometry is to measure cellular events one at a time; but, as discussed in our page about fluidics, the core stream flow rate/cross-sectional area can be adjusted to accommodate samples with varying cell sizes. Slowing the flow rate has the benefit of increasing resolution (reducing overlapping cells -doublets) at the cost of increasing run time. Often the most desired scenario is to find a balance between single cell resolution and run time; however that still leaves the issue of how to differentiate and discard data from doublet cells.
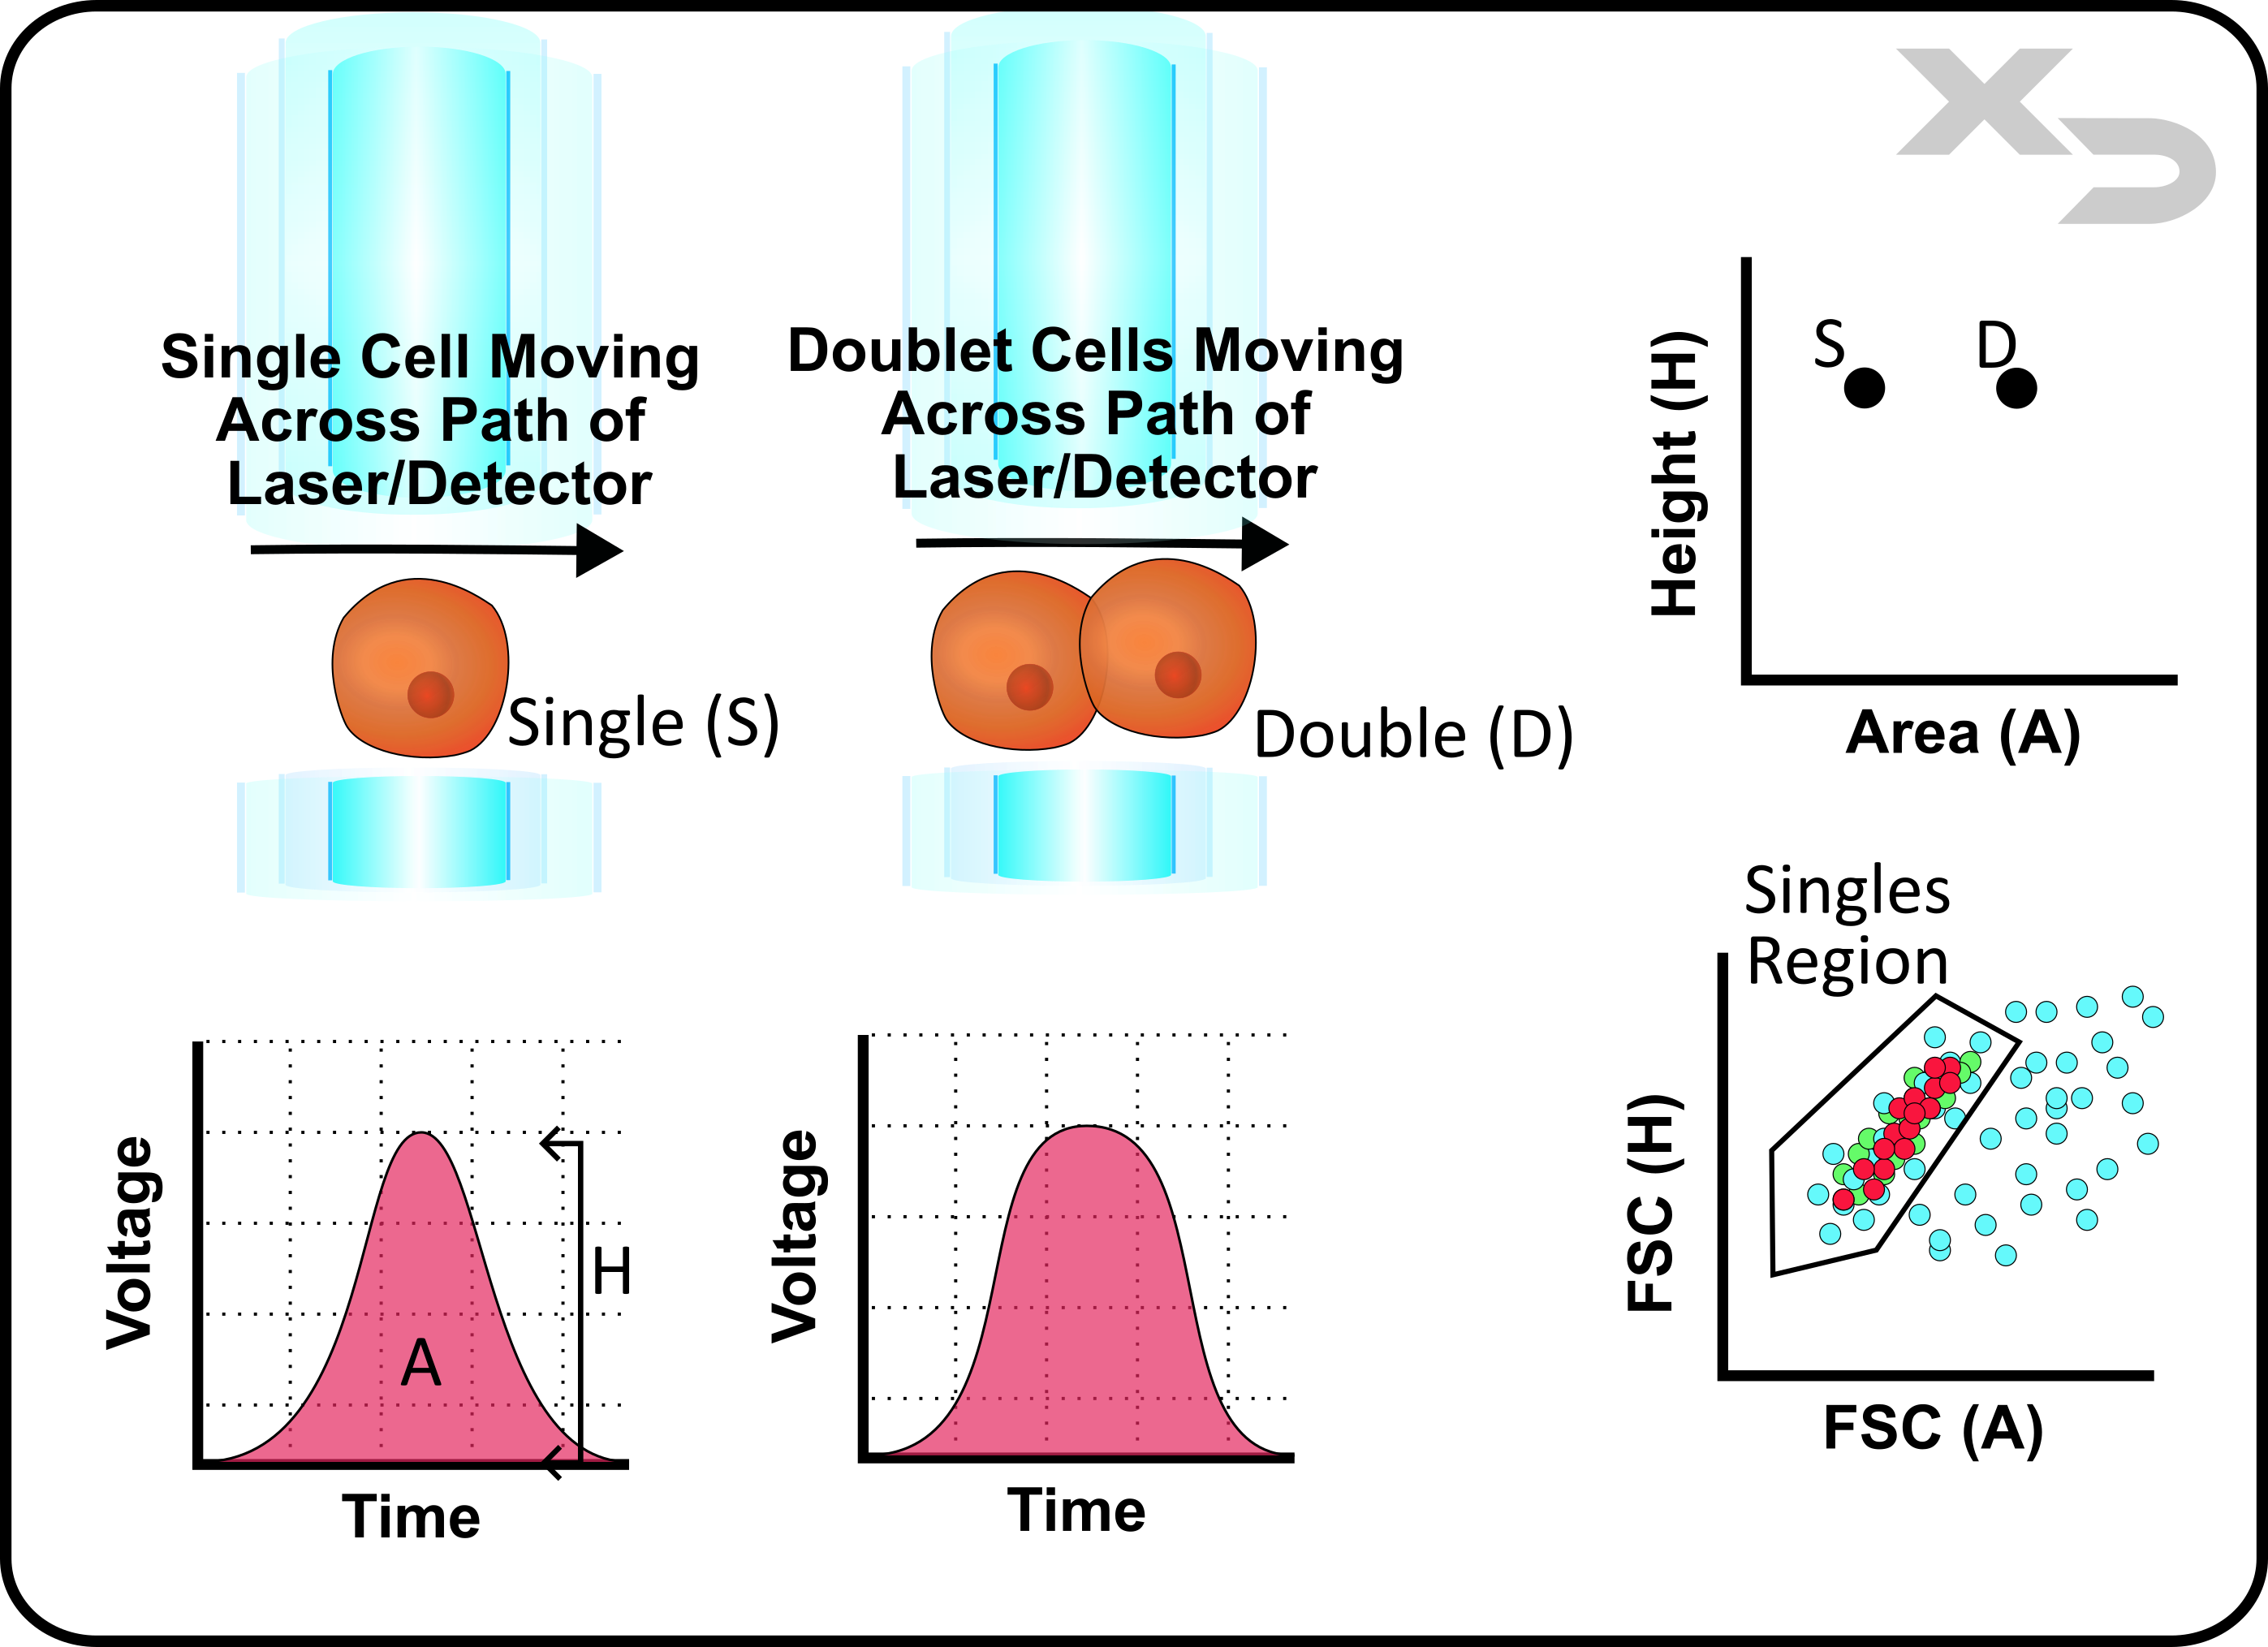
Doublet discrimination can be achieved using the forward scatter (FSC) perameter as it is a reflection of cellular size. As discussed in the sections above, the voltage/time curve for any cellular event can be analyzed by either height (H) or integrated area (A). When a doublet cell passes by the laser, the measured voltage height does not change nearly as much as the witdth (time) that it takes to pass the laser. Thus if the ratio of A/H is calculated, doublets will always tend to have a much higher ratio; ideally independent of cell size.
Of course in practice this is more complex, as it depends on the size of both cells, as well as the angle/orientation that the passed by the laser, and other confounding factors. Not to mention that the sample population is likely comprised of different cell types of many different sizes. As such, when plotting FSC (H) vs FSC (A), the difference in singlet vs doublet isn’t perfectly clear cut. However, as the figure below illustrates, there should be a noticable region in the density plot where there is a greater concentration of cells. This is the region where the vast majority of singlets are located, and can be gated on to exclude cells with high A/H ratios.
While this method isn’t fool-proof, the benefit of flow cytometry is the ability to measure tens to hundreds-of thousand cellular events, allowing for robust data collection even if a significant portion of cellular events are discarded.
We have designed several informational pages with custom graphics to help explain the complex concepts of flow cytometry.
"*" indicates required fields
Copyright © 2021. All rights reserved.
